

Multi-timepoint pattern analysis: Influence of personality and behavior on decoding context-dependent brain connectivity dynamics
- PMID: 34859934
- PMCID: PMC8837593
- DOI: 10.1002/hbm.25732
Multi-timepoint pattern analysis: Influence of personality and behavior on decoding context-dependent brain connectivity dynamics
Abstract
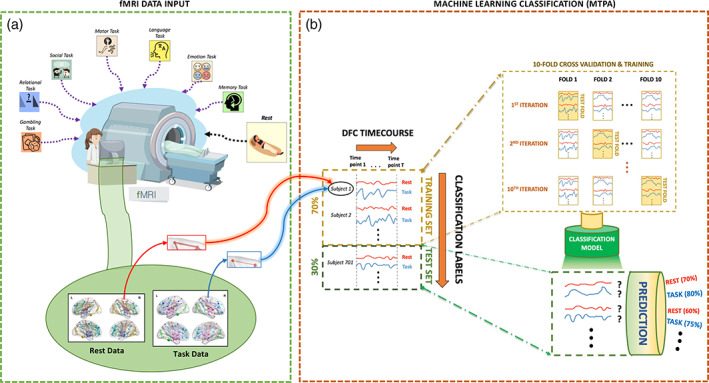
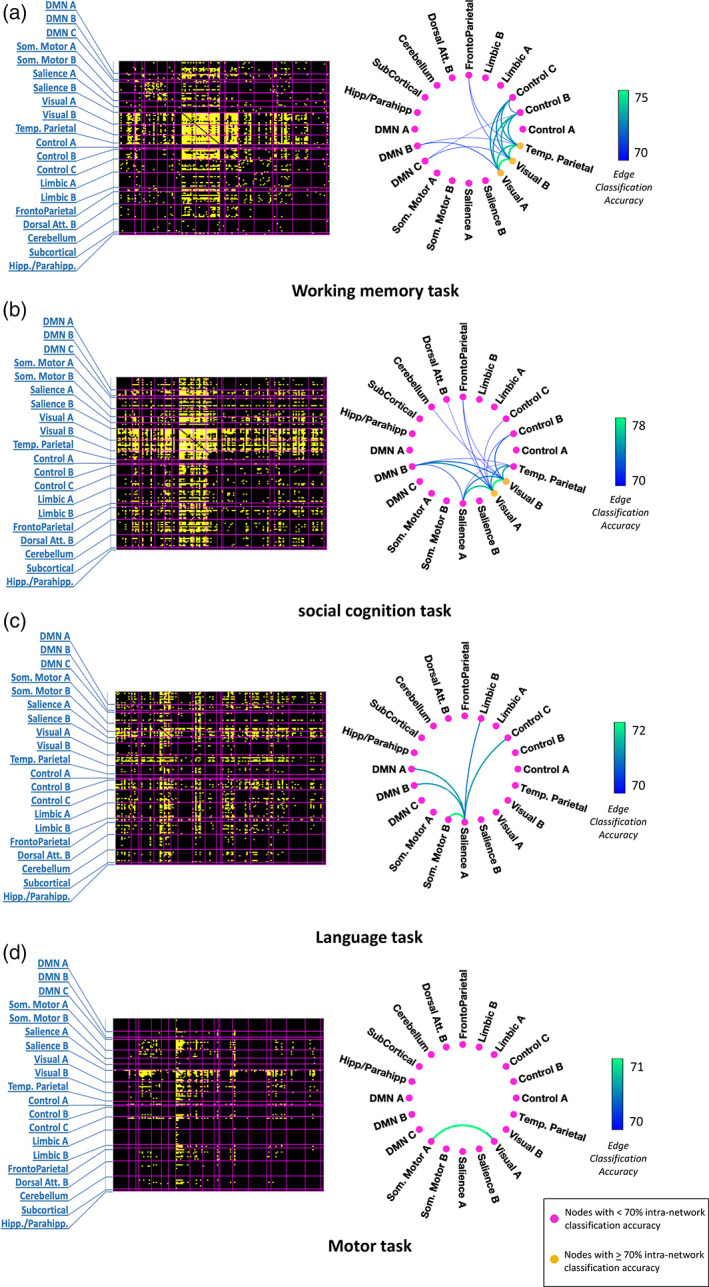
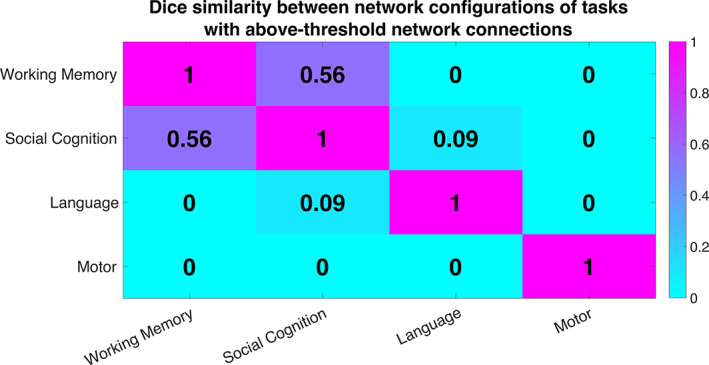
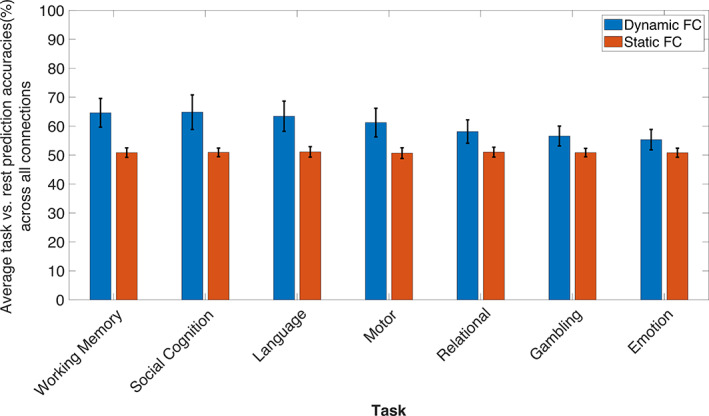
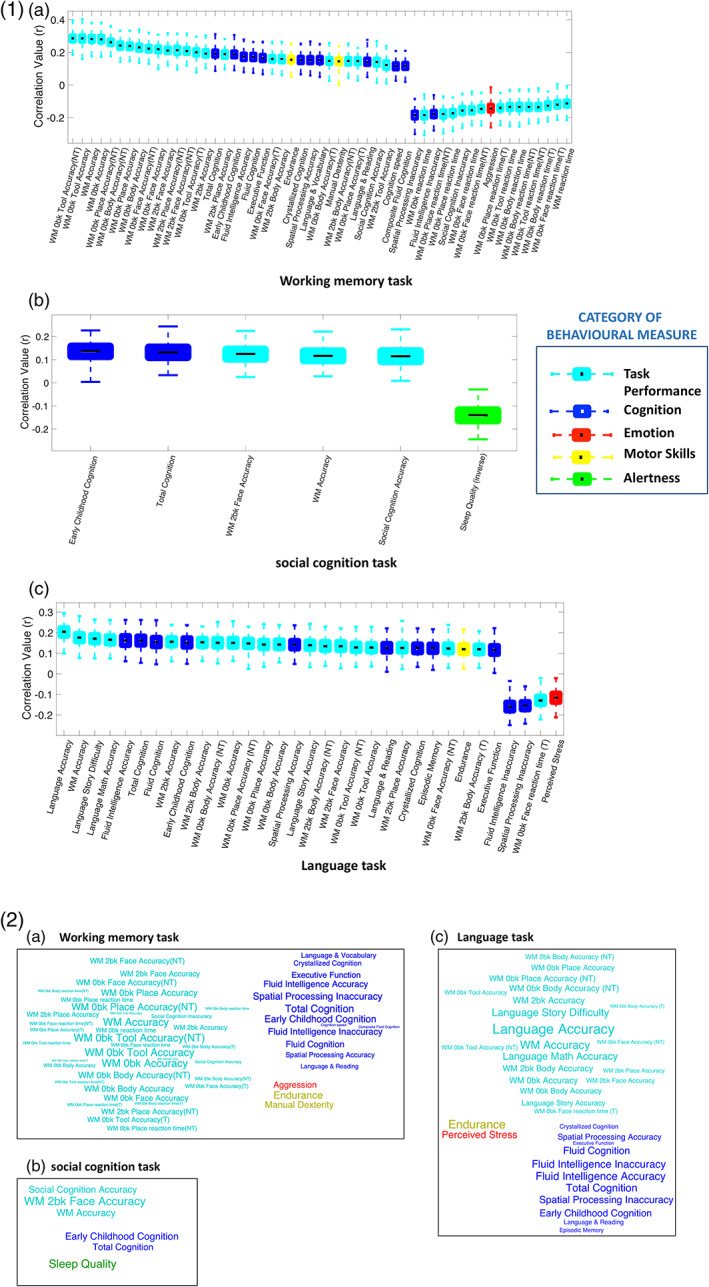
Behavioral traits are rarely considered in task-evoked functional magnetic resonance imaging (MRI) studies, yet these traits can affect how an individual engages with the task, and thus lead to heterogeneity in task-evoked brain responses. We aimed to investigate whether interindividual variation in behavior associates with the accuracy of predicting task-evoked changes in the dynamics of functional brain connectivity measured with functional MRI. We developed a novel method called multi-timepoint pattern analysis (MTPA), in which binary logistic regression classifiers were trained to distinguish rest from each of 7 tasks (i.e., social cognition, working memory, language, relational, motor, gambling, emotion) based on functional connectivity dynamics measured in 1,000 healthy adults. We found that connectivity dynamics for multiple pairs of large-scale networks enabled individual classification between task and rest with accuracies exceeding 70%, with the most discriminatory connections relatively unique to each task. Crucially, interindividual variation in classification accuracy significantly associated with several behavioral, cognition and task performance measures. Classification between task and rest was generally more accurate for individuals with higher intelligence and task performance. Additionally, for some of the tasks, classification accuracy improved with lower perceived stress, lower aggression, higher alertness, and greater endurance. We conclude that heterogeneous dynamic adaptations of functional brain networks to changing cognitive demands can be reliably captured as linearly separable patterns by MTPA. Future studies should account for interindividual variation in behavior when investigating context-dependent dynamic functional connectivity.
Keywords: behavior; brain network; dynamic functional connectivity; functional MRI; logistic regression; rest; task.
© 2021 The Authors. Human Brain Mapping published by Wiley Periodicals LLC.
Conflict of interest statement
The authors declare no potential conflicts of interest.
Figures
Similar articles
-
Tracking spatial dynamics of functional connectivity during a task.Neuroimage. 2021 Oct 1;239:118310. doi: 10.1016/j.neuroimage.2021.118310. Epub 2021 Jun 24. Neuroimage. 2021. PMID: 34175424
-
The Functional Relevance of Task-State Functional Connectivity.J Neurosci. 2021 Mar 24;41(12):2684-2702. doi: 10.1523/JNEUROSCI.1713-20.2021. Epub 2021 Feb 4. J Neurosci. 2021. PMID: 33542083 Free PMC article.
-
Large-scale intrinsic connectivity is consistent across varying task demands.PLoS One. 2019 Apr 10;14(4):e0213861. doi: 10.1371/journal.pone.0213861. eCollection 2019. PLoS One. 2019. PMID: 30970031 Free PMC article.
-
Spatio-temporal modeling of connectome-scale brain network interactions via time-evolving graphs.Neuroimage. 2018 Oct 15;180(Pt B):350-369. doi: 10.1016/j.neuroimage.2017.10.067. Epub 2017 Nov 10. Neuroimage. 2018. PMID: 29102809 Free PMC article. Review.
-
Beyond Functional Connectivity: Investigating Networks of Multivariate Representations.Trends Cogn Sci. 2018 Mar;22(3):258-269. doi: 10.1016/j.tics.2017.12.002. Epub 2018 Jan 2. Trends Cogn Sci. 2018. PMID: 29305206 Review.
Cited by
-
Within-subject reliability of brain networks during advanced meditation: An intensively sampled 7 Tesla MRI case study.Hum Brain Mapp. 2024 May;45(7):e26666. doi: 10.1002/hbm.26666. Hum Brain Mapp. 2024. PMID: 38726831 Free PMC article.
-
Functional brain network dynamics of brooding in depression: insights from real-time fMRI neurofeedback.medRxiv [Preprint]. 2024 May 6:2024.05.05.24306889. doi: 10.1101/2024.05.05.24306889. medRxiv. 2024. Update in: J Affect Disord. 2025 Jul 1;380:191-202. doi: 10.1016/j.jad.2025.03.121. PMID: 38766116 Free PMC article. Updated. Preprint.
-
Explainable deep-learning framework: decoding brain states and prediction of individual performance in false-belief task at early childhood stage.Front Neuroinform. 2024 Jun 28;18:1392661. doi: 10.3389/fninf.2024.1392661. eCollection 2024. Front Neuroinform. 2024. PMID: 39006894 Free PMC article.
-
Building a tissue-unbiased brain template of fiber orientation distribution and tractography with multimodal registration.Magn Reson Med. 2023 Mar;89(3):1207-1220. doi: 10.1002/mrm.29496. Epub 2022 Oct 26. Magn Reson Med. 2023. PMID: 36299169 Free PMC article.
References
Publication types
MeSH terms
LinkOut - more resources
Full Text Sources
Medical
