. 2021 Dec 3;7(49):eabj2151.
doi: 10.1126/sciadv.abj2151. Epub 2021 Dec 3.

Thrice out of Asia and the adaptive radiation of the western honey bee

Affiliations

Thrice out of Asia and the adaptive radiation of the western honey bee

Kathleen A Dogantzis et al. Sci Adv. .

Abstract

The origin of the western honey bee Apis mellifera has been intensely debated. Addressing this knowledge gap is essential for understanding the evolution and genetics of one of the world’s most important pollinators. By analyzing 251 genomes from 18 native subspecies, we found support for an Asian origin of honey bees with at least three expansions leading to African and European lineages. The adaptive radiation of honey bees involved selection on a few genomic “hotspots.” We found 145 genes with independent signatures of selection across all bee lineages, and these genes were highly associated with worker traits. Our results indicate that a core set of genes associated with worker and colony traits facilitated the adaptive radiation of honey bees across their vast distribution.


Figures

Fig. 1.
Fig. 1.. Population structure and phylogenetic reconstruction of A. mellifera.
(A) Map of the native distribution of the seven genetically distinct lineages. (B) Patterns of ancestry and population structure identified with ADMIXTURE when K = 7. Vertical bars represent individual bees, and colored segments represent the proportion of ancestry to the different clusters. (C) Evolutionary relationships among A. mellifera samples reconstructed with a neighbor-joining tree using SNPs located genome-wide. Asterisks represent node support of 100%. (D) Evolutionary relationships among A. mellifera samples constructed with a neighbor-joining tree using SNPs located within protein-coding regions. Asterisks represent node support of 100%. Node support and maximum likelihood phylogenetic trees can be found in the Supplementary Materials.
Fig. 2.
Fig. 2.. Ancestral biogeographic range reconstruction of A. mellifera using two resolved topologies.
The current geographic range of subspecies is indicated at branch tips by letters A (Asia), F (Africa), and E (Europe). Colored bars to the right of the trees indicate the lineage association of the subspecies. Pie charts at nodes indicate the marginal maximum likelihood probabilities for the estimated ancestral range. The ancestral range is predicted to be in Asia, with an estimated probability of 64 to 73%. (A) represents the topology reconstructed using SNPs located throughout the genome, while (B) represents the topology reconstructed with SNPs located in protein coding regions. Node probabilities and the biogeographic reconstruction of the Apis genus can be found in the Supplementary Materials.
Fig. 3.
Fig. 3.. Proportion of genes that overlap among lineages and across the A. mellifera genome.
(A) to (G) illustrate the proportion of genes that are either unique to a lineage or share signs of selection among one to six other lineages. (H) illustrates the proportion of genes across the genome that have outlier SNPs among no lineages to all seven lineages.
Fig. 4.
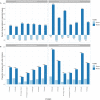
Fig. 4.. Association of genes with outlier loci among the worker and queen caste.
(A) Percent change in the observed number of genes with outlier SNPs among queen- and worker-biased genes for larvae and adults, relative to expected values. For example, a negative change suggests an underrepresentation of genes, a positive change represents an enrichment of genes, and no change suggests no difference from expected values. Asterisks represent the degree of significance of the change between observed and expected values (*P < 0.05, **P < 0.01, and ***P < 0.001), while N.S. is not statistically significant. (B) Proportion of genes with outlier SNPs among worker caste– and queen caste–biased genes for larvae and adults for each lineage. Asterisks represent the degree of significant difference between the proportions (*P < 0.05, **P < 0.01, and ***P < 0.001).

References

    1. Arias M. C., Sheppard W. S., Phylogenetic relationships of honey bees (Hymenoptera: Apinae: Apini) inferred from nuclear and mitochondrial DNA sequence data. Mol. Phylogenet. Evol. 37, 25–35 (2005). - PubMed
    1. Lo N., Gloag R. S., Anderson D. L., Oldroyd B. P., A molecular phylogeny of the genus Apis suggests that the Giant Honey Bee of the Philippines, A. breviligula Maa, and the Plains Honey Bee of southern India, A. indica Fabricius, are valid species. Syst. Entomol. 35, 226–233 (2010).
    1. Raffiudin R., Crozier R. H., Phylogenetic analysis of honey bee behavioral evolution. Mol. Phylogenet. Evol. 43, 543–552 (2007). - PubMed
    1. Dogantzis K. A., Zayed A., Recent advances in population and quantitative genomics of honey bees. Curr. Opin. Insect Sci. 31, 93–98 (2019). - PubMed
    1. F. Ruttner, Biogeography and Taxonomy of Honeybees (Springer Berlin Heidelberg, 1988).