. 2021 Dec 3;7(49):eabk2360.
doi: 10.1126/sciadv.abk2360. Epub 2021 Dec 3.

Spatially uniform dynamics in equilibrium colloidal gels

Affiliations

Spatially uniform dynamics in equilibrium colloidal gels

Enrico Lattuada et al. Sci Adv. .

Abstract

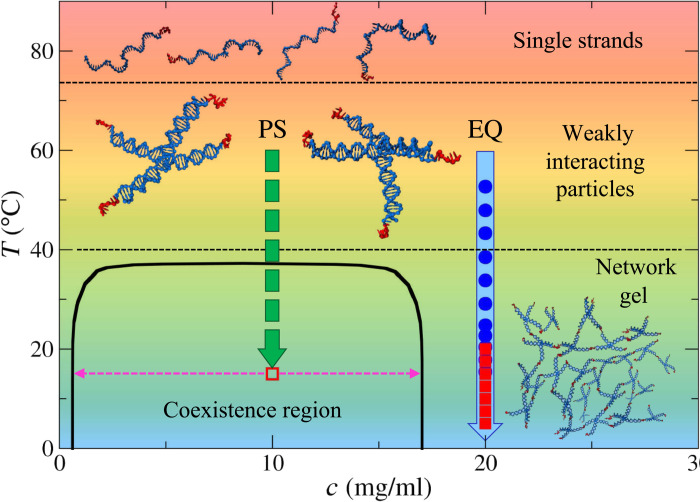
Gels of DNA nanostars, besides providing a compatible scaffold for biomedical applications, are ideal model systems for testing the physics of equilibrium colloidal gels. Here, using dynamic light scattering and photon correlation imaging (a recent technique that, by blending light scattering and imaging, provides space-resolved quantification of the dynamics), we follow the process of gel formation over 10 orders of magnitude in time in a model system of tetravalent DNA nanostars in solution, a realization of limited-valence colloids. Such a system, depending on the nanostar concentration, can form either equilibrium or phase separation gels. In stark contrast to the heterogeneity of concentration and dynamics displayed by the phase separation gel, the equilibrium gel shows absence of aging and a remarkable spatially uniform dynamics.


Figures

Fig. 1.
Fig. 1.. Schematic phase diagram of the system.
At high T (> 80°C), the DNA single strands freely diffuse in the solvent. At intermediate T (40°C < T < 75°C), the strands assemble into the NS-shaped tetravalent nanoparticle. For T < 40°C, the particles start to interact via the sticky tips. When the DNA concentration c is within the range of the coexistence region (1 < c < 17 mg/ml), the system phase separates into dense and dilute phases for T < 37°C. Outside this region, the particles are able to form an equilibrium network. The coexistence line is adapted from (38). The arrow on the right shows the experimental path for the equilibrium gel sample EQ (cEQ = 20 mg/ml), with the full circles and squares, respectively, indicating the temperatures where the measurements with DLS and PCI have been performed. The phase-separated sample PS, prepared at cPS = 10 mg/ml, was instead directly quenched from 60°C to 15°C (dashed arrow), which led to rapid phase separation and kinetic slowing down.
Fig. 2.
Fig. 2.. EQ sample correlation functions obtained by DLS and PCI.
Correlation functions, covering 10 orders of magnitude in time, measured with DLS (dots) and PCI (lines) from the equilibrium gel sample for several selected temperatures, shown in the legend.
Fig. 3.
Fig. 3.. Temperature dependence of the slow relaxation.
Temperature dependence of the average slow decay time 〈τs〉 obtained either by DLS (dots) or by PCI (squares). The dashed line is the best fit of the experimental data using the Arrhenius equation 〈τs〉 ~ exp(−ΔH/RT). The amplitude A of the slow relaxation contribution is shown in the lower right inset. Its stretch exponent βs is plotted in the top left inset, with the lines indicating the average value ± SD.
Fig. 4.
Fig. 4.. Time dependence of the intensity correlation functions of samples EQ and PS.
Time (t) dependence of g2(τ;t) − 1 at fixed delay τ, indicated by the labels, for samples EQ and PS at T = 15°C. Note that, independently on the starting time of the measurement t, the value of the correlation function at delay time τ remains constant, confirming the absence of aging and the temporal homogeneity on the time scale of the measurement.
Fig. 5.
Fig. 5.. Correlation maps and distribution of slow decay times.
Correlation maps at T = 15°C, showing the local values of g2(τ;r) − 1 when the spatially averaged correlation function 〈g2(τ;r) − 1〉r has attained a value C = 0.85 (left) and C = 0.5 (middle). These values correspond to τ = 0.5 s and 1 s, for C = 0.85, and to τ = 5.4 s and 17.3 s, for C = 0.5, for sample EQ and PS, respectively. The scale bars mapping the color to the value of g2(τ;r) − 1 are shown in between the corresponding correlation maps; the triangle indicates the selected value of C. Panels on the right show histograms of the characteristic time 〈τs〉 obtained by fitting all the computed correlation functions. Panels in the top and bottom rows refer to samples EQ and PS, respectively. Notice that here the values of the correlation functions are not rescaled, contrarily to what was done in Fig. 2 to compare the data with the DLS measurements.

References

    1. Geiger A., Stillinger F. H., Rahman A., Aspects of the percolation process for hydrogen-bond networks in water. J. Chem. Phys. 70, 4185–4193 (1979).
    1. Stanley H. E., Teixeira J., Interpretation of the unusual behavior of H2O and D2O at low temperatures: Tests of a percolation model. J. Chem. Phys. 73, 3404–3422 (1980).
    1. Sciortino F., Gel-forming patchy colloids and network glass formers: Thermodynamic and dynamic analogies. Eur. Phys. J. B 64, 505–509 (2008).
    1. M. Rubinstein, R. H. Colby, Polymer Physics (OUP Oxford, 2003).
    1. F. Tanaka, Polymer Physics: Applications to Molecular Association and Thermoreversible Gelation (Cambridge Univ. Press, 2011).