. 2022 Mar 31;139(13):2038-2049.
doi: 10.1182/blood.2021012652.

Coordinated missplicing of TMEM14C and ABCB7 causes ring sideroblast formation in SF3B1-mutant myelodysplastic syndrome

Affiliations

Coordinated missplicing of TMEM14C and ABCB7 causes ring sideroblast formation in SF3B1-mutant myelodysplastic syndrome

Courtnee A Clough et al. Blood. .

Abstract

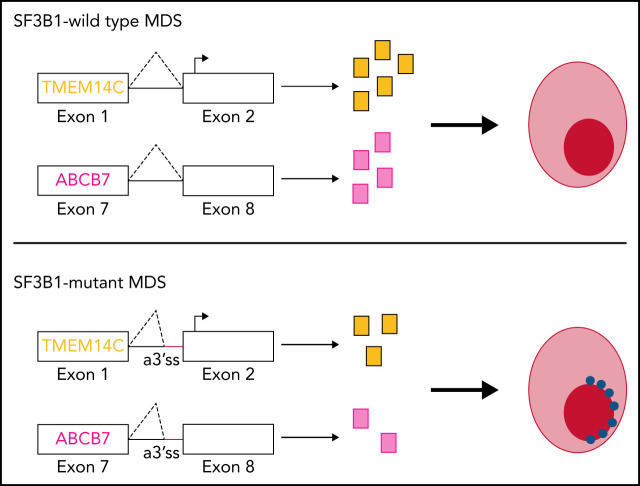
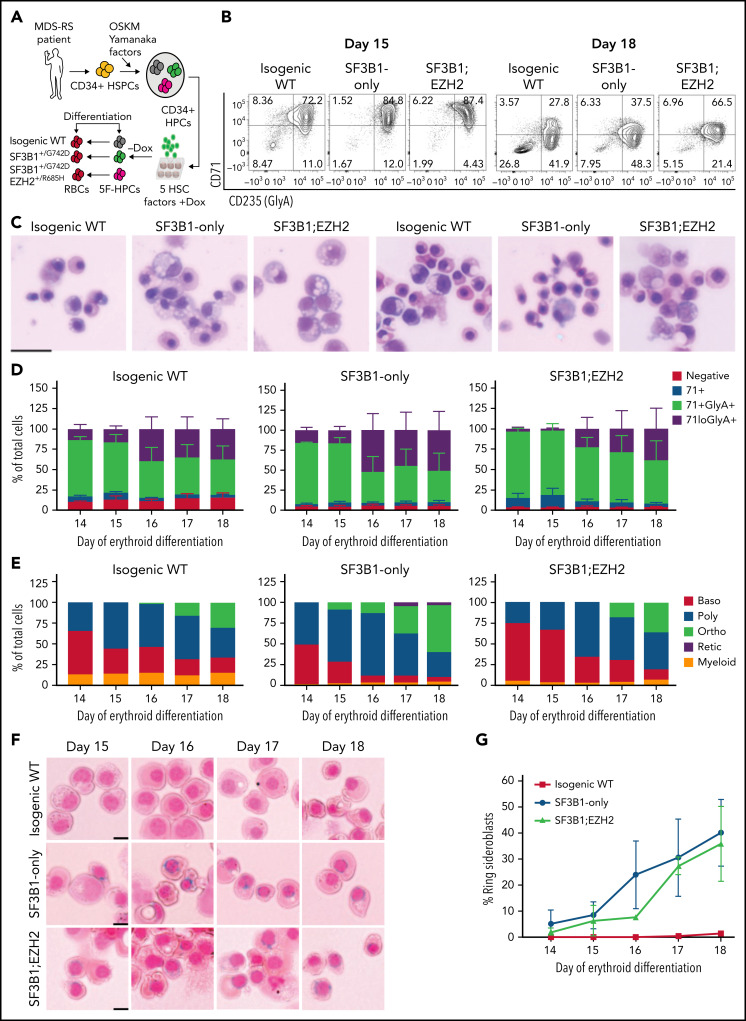
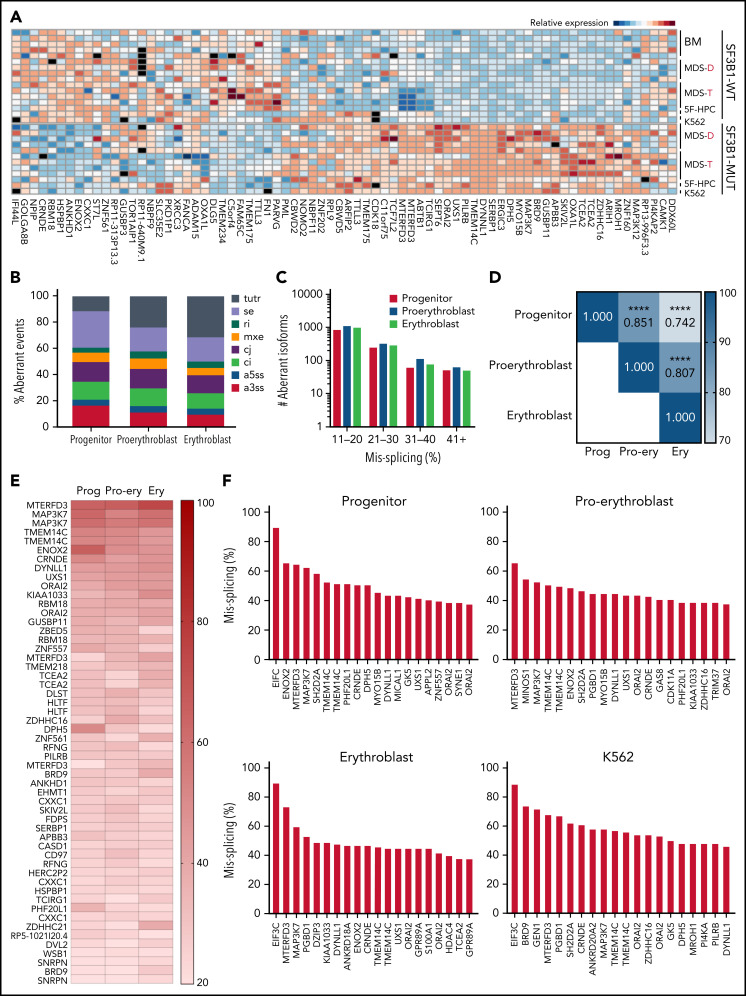
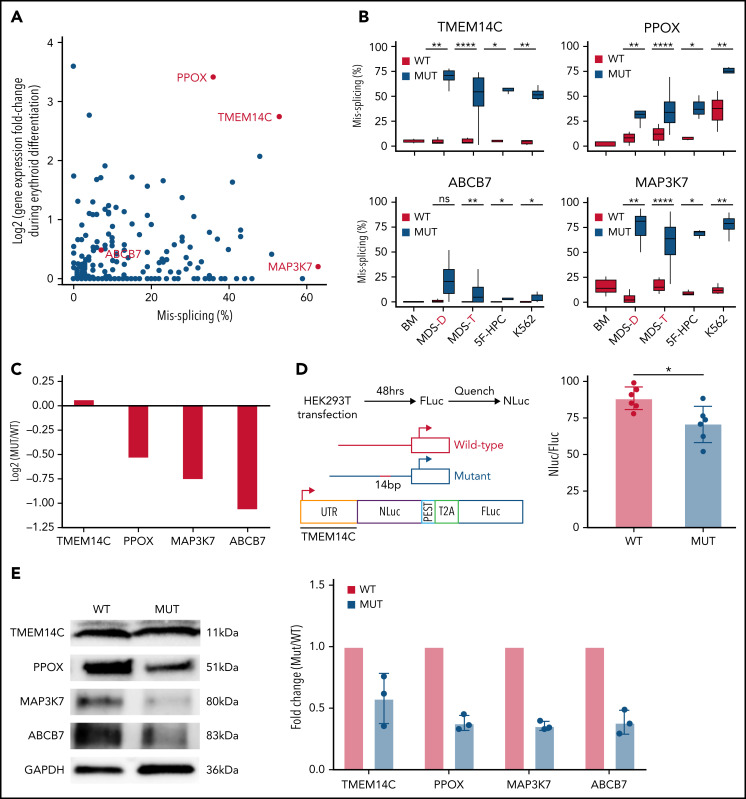
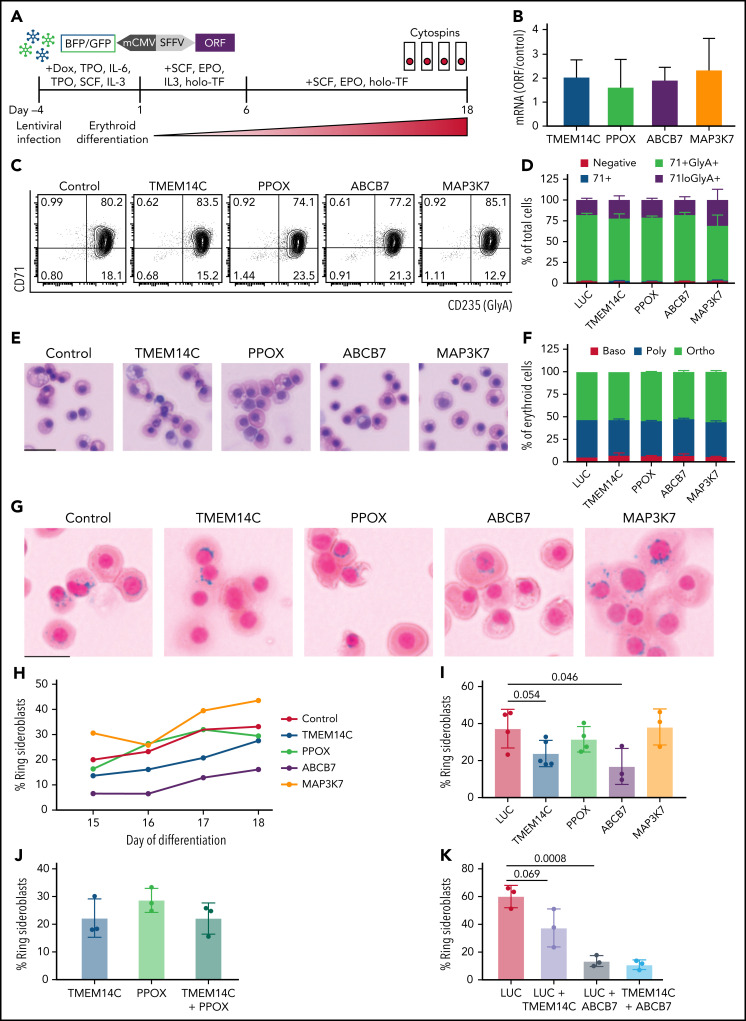
SF3B1 splicing factor mutations are near-universally found in myelodysplastic syndromes (MDS) with ring sideroblasts (RS), a clonal hematopoietic disorder characterized by abnormal erythroid cells with iron-loaded mitochondria. Despite this remarkably strong genotype-to-phenotype correlation, the mechanism by which mutant SF3B1 dysregulates iron metabolism to cause RS remains unclear due to an absence of physiological models of RS formation. Here, we report an induced pluripotent stem cell model of SF3B1-mutant MDS that for the first time recapitulates robust RS formation during in vitro erythroid differentiation. Mutant SF3B1 induces missplicing of ∼100 genes throughout erythroid differentiation, including proposed RS driver genes TMEM14C, PPOX, and ABCB7. All 3 missplicing events reduce protein expression, notably occurring via 5' UTR alteration, and reduced translation efficiency for TMEM14C. Functional rescue of TMEM14C and ABCB7, but not the non-rate-limiting enzyme PPOX, markedly decreased RS, and their combined rescue nearly abolished RS formation. Our study demonstrates that coordinated missplicing of mitochondrial transporters TMEM14C and ABCB7 by mutant SF3B1 sequesters iron in mitochondria, causing RS formation.


Figures

None
Graphical abstract
Figure 1.
Figure 1.
iPSC model of SF3B1-mutant MDS with RS. (A) Schematic of iPSC reprogramming to generate an SF3B1-mutant MDS-RS model. MDS-RS patient CD34+ cells were reprogrammed with episomal factors and 3 iPSC lines were selected: normal isogenic WT, SF3B1G742D/+, and SF3B1G742D/+;EZH2/R685H/+. iPSCs were differentiated into CD34+ HPCs and transduced with 5 transcription factors (ERG, HOXA9, RORA, SOX4, MYB) to establish doxycycline-expandable 5F-HPCs, which serve as progenitor lines for erythroid differentiation studies. (B) Representative flow plots of CD71 and CD235 (Glycophorin A) expression in isogenic WT, SF3B1G742D/+, and SF3B1G742D/+;EZH2R685H/+ cells on days 15 and 18 of erythroid differentiation. (C) Representative May-Grunwald Giemsa staining of erythroid cell morphology on days 15 (left 3 images) and 18 (right 3 images) of differentiation. Scale bar, 25 μm. (D) Erythroid differentiation staging using CD71 and GlyA levels measured by flow cytometry using the gating strategy shown in 1B from days 14 to 18 of erythroid differentiation; mean ± standard error of the mean of n = 3. (E) Quantification of erythroid cell morphology using May-Grunwald Giemsa staining from days 14 to 18. A representative experiment was counted; >30 cells counted for each day of differentiation. (F) Representative images of RS iron staining in SF3B1-WT and SF3B1-mutant cells. Erythroid cells were collected on days 15 through 18 of erythroid differentiation and stained with Perls Prussian blue. Scale bar, 10 μm. (G) Quantification of RS counts in the isogenic WT and SF3B1G742D/+ erythroid cells; >200 cells counted; mean ± standard deviation (SD) of n = 3 independent experiments and SF3B1G742D/+;EZH2/R685H/+ cells; mean ± SD of n = 2; >150 cells counted. Baso, basophilic erythroblast; poly, polychromatic erythroblast; ortho, orthochromatic erythroblast; retic, reticulocyte.
Figure 2.
Figure 2.
Mutant SF3B1 missplicing during iPSC erythroid differentiation. (A) Relative expression of the indicated differentially spliced isoforms in SF3B1-WT and SF3B1-mutant cells. Plot restricted to competing 3′ splice sites, cassette exons, and retained introns. Normal samples include: bone marrow HPCs (BM), MDS without SF3B1 mutations (WT), K562 cells, and normal isogenic iPSC-derived 5F-HPCs. SF3B1-mutant samples include: SF3B1-mutant MDS, K562 SF3B1K700E/+ cells, and SF3B1G742D/+ iPSC-derived 5F-HPCs. Events were restricted to ≥20% missplicing, Bayes factor ≥5, and a minimum counts cutoff ≥20. MDS-D refers to SF3B1K700E/+ patient data from Dolatshad et al and MDS-T refers to SF3B1K700E/+ patient data from Taylor et al. (B) The proportion of misspliced isoforms in 5F-HPCs: progenitor CD34+, proerythroblast CD71+GlyA, and erythroblast CD71+GlyA+. Splicing events classified as arising from tandem 3′ UTRs (tutr), cassette or skipped exons (se), retained introns (ri), mutually exclusive exons (mxe), alternative usage of normally constitutively spliced junctions (cj), alternative retention of normally constitutively spliced introns (ci), alternative 5′ss (a5ss), and alternative 3′ss (a3ss). (C) The number of misspliced isoforms grouped by absolute value of missplicing at the 3 stages of erythroid differentiation of 5F-HPCs: progenitor CD34+, proerythroblast CD71+GlyA, and erythroblast CD71+GlyA+. (D) Pearson correlation matrix of the level of missplicing between the 3 stages of erythroid differentiation of SF3B1G742D/+ 5F-HPCs. ****P < .0001. (E) The level of missplicing of individual gene isoforms during erythroid differentiation of SF3B1G742D/+ 5F-HPCs; included isoforms were detected at all the stages of differentiation. (F) Top 20 misspliced a3ss isoforms in SF3B1-mutant 5F-HPCs and 3 stages of erythroid cells: CD71+ proerythroblasts, CD71+GlyA+ erythroblasts, and K562s. Unless otherwise stated, for all panels, differential missplicing between SF3B1-mutant and WT cells is defined based on the absolute value of missplicing ≥20%, Bayes factor >5, and supported by >5 transcript counts. Prog, progenitor; Pro-ery, proerythroblast; Ery, erythroblast.
Figure 3.
Figure 3.
Missplicing downregulates expression of SF3B1 target genes. (A) Identification of erythroid-specific mutant SF3B1 targets based on the level of missplicing vs fold change of transcript expression during normal erythroid differentiation. Selected genes were misspliced in both SF3B1-mutant MDS patient cells and iPSC 5F-HPC derived erythroid cells. (B) Total level of missplicing of TMEM14C, PPOX, ABCB7, and MAP3K7 in normal bone marrow (BM), SF3B1-WT and mutant MDS patients, 5F-HPCs, and K562s. *P < .5, **P < .01, ***P < .001, ****P < .0001, 1-sided Mann-Whitney U test. MDS-D refers to SF3B1K700E/+ patient data from Dolatshad et al and MDS-T refers to SF3B1K700E/+ patient data from Taylor et al. (C) The change in RNA expression (log fold) by RNA-seq in SF3B1-mutant compared with isogenic WT 5F-HPC-derived erythroid cells. (D) The efficiency of LUC translation in reporter assay with WT or mutant TMEM14C 5′UTR. Left: The schematic of WT and mutant TMEM14C 5′UTR and dual LUC 5′UTR reporter design. Right: The ratio of nano-LUC to firefly LUC fluorescence with WT or mutant TMEM14C 5′UTR. N = 6 independent experiments, *P = .015, Student t test. (E) Western blot analysis of TMEM14C, PPOX, MAP3K7, and ABCB7 protein levels at day 14 of erythroid differentiation of SF3B1-mutant and isogenic WT 5F-HPC derived erythroid cells. The expression was normalized to glyceraldehyde-3-phosphate dehydrogenase and shown as fold-change of SF3B1-mutant vs WT; 3 independent experiments, mean ± SD.
Figure 4.
Figure 4.
Rescue of TMEM14C and ABCB7 reduces RS formation. (A) Schematic of the functional RS rescue experiments. SF3B1-mutant 5F-HPCs were transduced with lentiviruses overexpressing individual ORFs or LUC control to 50-70% transduction efficiency. To induce differentiation, doxycycline was removed and cells were moved into erythroid differentiation media containing SCF, EPO, IL-3, and holo-TF (without exogenous iron) for 6 days prior to the removal of IL-3 from culture. Cytospins were collected between days 15 and 18 as indicated and stained for RS with Prussian blue. (B) ORF mRNA overexpression level measured by quantitative PCR and normalized to LUC control at day 15 of erythroid differentiation; mean ± SD of n = 3 independent experiments. (C) Representative CD71 and GlyA flow plots of SF3B1-mutant cells expressing each ORF or LUC control on day 18 of erythroid differentiation. CD71 and GlyA staining is indicative of the stage of erythroid differentiation. (D) Erythroid differentiation staging using CD71 and GlyA levels as measured by flow cytometry using gating strategy shown in 4C at day 18 of erythroid differentiation; mean ± SEM of n = 3. (E) Representative May-Grunwald Giemsa staining of erythroid cell morphology on day 18 of erythroid differentiation. Scale bar = 25 mm. (F) Quantification of erythroid cell morphology using May-Grunwald Giemsa staining from day 18 of erythroid differentiation; 2 independent experiments. (G) Representative cytospin images of erythroid cells expressing each ORF or LUC control stained with Prussian blue iron staining for RS quantification. Scale bar = 25 mm. (H) Quantification of RS counts in SF3B1-mutant cells expressing each ORF or LUC control over the course of days 15-18 of erythroid differentiation. Mean values are shown for each day, TMEM14C, ABCB7, LUC control n = 3 independent experiments; PPOX and MAP3K7 n = 2 independent experiments. (I) Maximum RS counts between days 15-18 of differentiation for each ORF or LUC control. Each point represents an independent experiment (n = 3 - 5 independent experiments), >500 erythroid cells counted per experiment; mean± SD. P values calculated using a t test. (J) RS counts on day 18 of erythroid differentiation for the combination of TMEM14C and PPOX, compared with TMEM14C or PPOX alone. Each point represents an independent experiment, >500 erythroid cells counted per experiment; mean± SD. (K) RS counts on day 18 of erythroid differentiation for TMEM14C and ABCB7 combination compared to LUC combinations or LUC alone in SF3B1-mutant erythroid cells. Each point represents an independent experiment (n = 3), >500 erythroid cells counted per experiment; mean ± SD. P values calculated using a t test.

Comment in

References

    1. Cazzola M, Malcovati L. Diagnosis and treatment of sideroblastic anemias: from defective heme synthesis to abnormal RNA splicing. Hematology. 2015;2015:19-25. - PubMed
    1. Papaemmanuil E, Cazzola M, Boultwood J, et al. . Somatic SF3B1 mutation in myelodysplasia with ring sideroblasts. N Engl J Med. 2011;365:1384-1395. - PMC - PubMed
    1. Darman RB, Seiler M, Agrawal AA, et al. . Cancer-associated SF3B1 hotspot mutations induce cryptic 3′ splice site selection through use of a different branch point. Cell Rep. 2015;13(5):1033-1045. - PubMed
    1. Dolatshad H, Pellagatti A, Liberante F, et al. . Cryptic splicing events in the iron transporter ABCB7 and other key target genes in SF3B1-mutant myelodysplastic syndromes. Leukemia. 2016;30(12)2322-2331. - PMC - PubMed
    1. Malcovati L, Karimi M, Papaemmanuil E, et al. . SF3B1 mutation identifies a distinct subset of myelodysplastic syndrome with ring sideroblasts. Blood. 2015;126(2):233-241. - PMC - PubMed

Publication types

MeSH terms