. 2021 Dec 14;54(12):2812-2824.e4.
doi: 10.1016/j.immuni.2021.11.003. Epub 2021 Dec 2.

Microbiota-specific T follicular helper cells drive tertiary lymphoid structures and anti-tumor immunity against colorectal cancer

Affiliations

Microbiota-specific T follicular helper cells drive tertiary lymphoid structures and anti-tumor immunity against colorectal cancer

Abigail E Overacre-Delgoffe et al. Immunity. .

Abstract

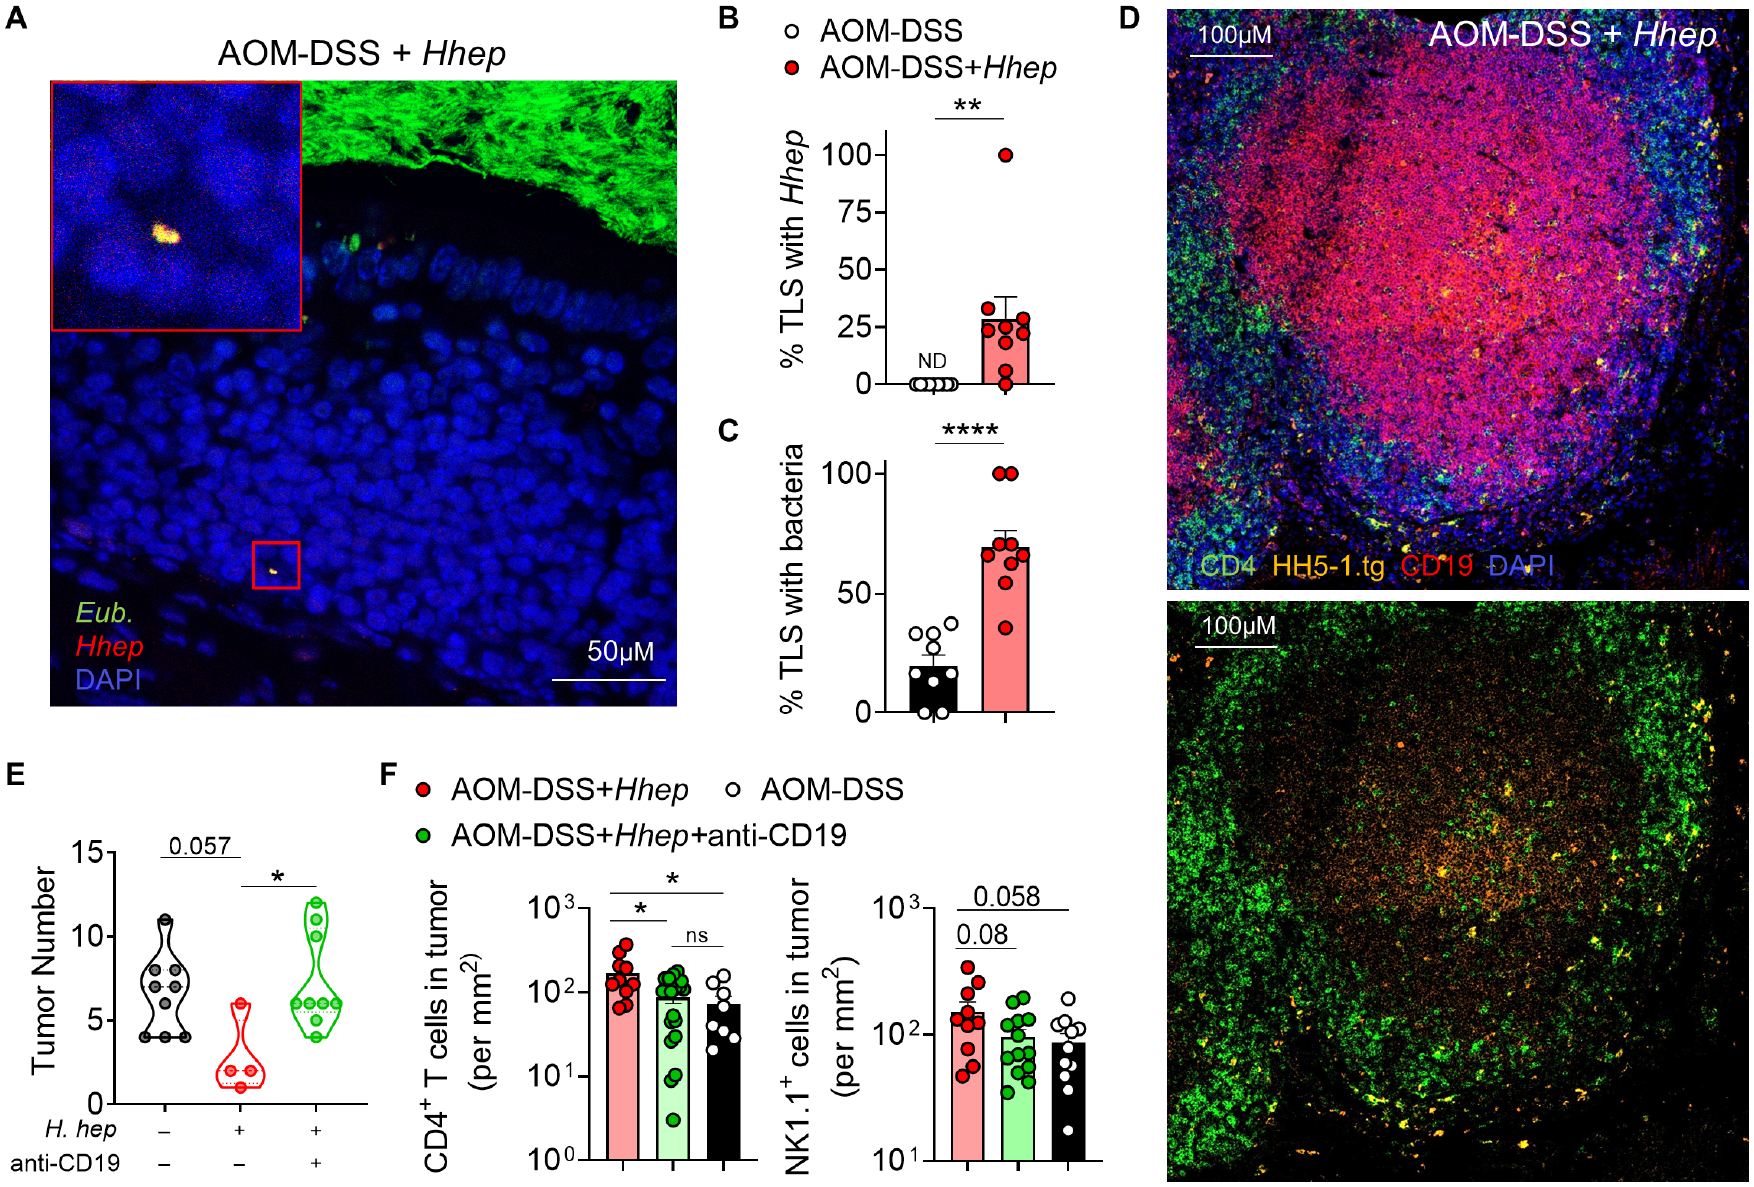
The composition of the intestinal microbiota is associated with both the development of tumors and the efficacy of anti-tumor immunity. Here, we examined the impact of microbiota-specific T cells in anti-colorectal cancer (CRC) immunity. Introduction of Helicobacter hepaticus (Hhep) in a mouse model of CRC did not alter the microbial landscape but increased tumor infiltration by cytotoxic lymphocytes and inhibited tumor growth. Anti-tumor immunity was independent of CD8+ T cells but dependent upon CD4+ T cells, B cells, and natural killer (NK) cells. Hhep colonization induced Hhep-specific T follicular helper (Tfh) cells, increased the number of colon Tfh cells, and supported the maturation of Hhep+ tumor-adjacent tertiary lymphoid structures. Tfh cells were necessary for Hhep-mediated tumor control and immune infiltration, and adoptive transfer of Hhep-specific CD4+ T cells to Tfh cell-deficient Bcl6fl/flCd4Cre mice restored anti-tumor immunity. Thus, introduction of immunogenic intestinal bacteria can promote Tfh-associated anti-tumor immunity in the colon, suggesting therapeutic approaches for the treatment of CRC.

Keywords: T cells; T follicular helper cell; colorectal cancer; microbiome; microbiota-specific T cells; tertiary lymphoid structure; tumor microenvironment.


Conflict of interest statement

Declaration of interests D.A.A.V., cofounder and stockholder – Novasenta and Tizona; stock holder – Oncorus and Werewolf; patents licensed and royalties – Astellas, BMS; scientific advisory board member – Tizona, Werewolf, and F-Star; consultant – Astellas, BMS, Almirall; research funding – BMS, Astellas, and Novasenta.

Figures

Figure 1.
Figure 1.. H. hepaticus reduces tumor burden and leads to long-term survival in colorectal cancer.
C57Bl/6 Hhep-free mice were injected i.p. with 10mg/kg AOM on day 0 and given 3% DSS in their drinking water on days 7–14, 28–35, and 49–56. Half of the mice were gavaged on day 45 and 49 with Hhep. (A) Experimental plan (B) qPCR of Hhep in the stool from the indicated timepoints of mice from (A). Dotted line represents the LOD. (C) Survival plots of mice from (A). (D) Tumor number and size from (C), plotted over time. (E) Tumor number and representative image of colons 12 weeks into the AOM-DSS protocol. (F-G) Representative image of immunofluorescence staining of colon sections 12 weeks post AOM. CD4 (green), CD19 (red), CD11c (purple), and DAPI (blue). (H-I) Quantification of CD4 T cells within the total tumor or percent found in the tumor core from (F-G). (J) Quantification of tumors with characteristics of a necrotic core at either 9- or 12-weeks post AOM. Fractions below each column represent the number of mice in each group that had at least one tumor with a necrotic core. Data are a composite of 2 (B-C) independent experiments with 9–10 mice per group, 7 (D) independent experiments with 4–5 mice per group, and 2 (F-J) independent experiments with 3 mice per group and 2–3 tumors per mouse quantified. Error bars represent the mean ± SEM. Kaplan-Meier (C), one way ANOVA (H) and student’s T test (D, I-J) were used. *p<0.05, **p<0.005, ***p<0.0005.
Figure 2.
Figure 2.. Hhep induces cytotoxic lymphocytes in and around colorectal tumors.
CRC was induced in mice as in 1A. (A-D) Cells from EL at week 12 of the AOM-DSS protocol (3 AOM-DSS mice, 3 AOM-DSS + Hhep mice) were enriched for CD45+ cells, labeled with CD45/MHCi cell hashing antibodies, and sequenced and analysed as single cell RNAseq samples. (A) Heatmap of 12 unique clusters found within the EL samples. (B) UMAP visualization and DRAGON clustering of EL revealed 12 unique clusters across all samples. (C) Quantification and forest plot of (B). (D) Subclustering of Cluster 1 (Cytotoxic lymphocytes). 7 unique clusters were identified. (E-F) Violin plots of (E)Gzma and (F)Cxcr3 within cells of the EL calculated from scRNAseq dataset. Data represent 1 independent experiment with 3 mice per group. Wilcoxon rank sum test was used (E-F). ***p<0.0005.
Figure 3.
Figure 3.. Hhep colonization drives Hhep-specific T follicular helper cell expansion.
CRC was induced in mice as in 1A. (A) Tumor number quantification from mice given AOM-DSS +/− Hhep where half the mice were treated with anti-CD4, anti-CD8, anti-NK1.1, or anti-NK1.1+anti-CD8 antibodies to deplete cells every 5 days starting on day 58. (B-E) Cells were isolated from the colons of tumor-bearing mice +/− Hhep 12 weeks post AOM and enriched for Hhep-specific tetramer+ or CD45.1+ Hhep-specific TCR transgenic cells prior to staining. (B) Shown are representative graphs of HH-E2 tetramer and CD44 to identify tetramer positive CD4 T cells from the LP. (C) Representative flow plots of tetramer positive and negative T cells (gated on total CD4+ or Tetramer+ CD4+ T cells as indicated) stained to identify Tfh cells. (D) Quantification of (C). (E) Time course of the percent of Tfh cells calculated from transferred HH5-1tg CD4+ (Hhep-specific) from different tissues, as indicated. Data represent 2–3 independent experiments with 3–4 mice per group per experiment. One-way ANOVA (A), and student’s T test (D) were used. *p<0.05, **p<0.005.
Figure 4.
Figure 4.. Hhep colonization expands the colonic lymphatic network.
(A) Cells from the LP were prepared and sequenced as in (Fig. 2). DRAGON clustering revealed 16 unique clusters in the LP and an increase in the lymphatics cluster (cluster 9) in the LP of Hhep-colonized mice. (B) Subclustering of Cluster 9 (lymphatics) from scRNASeq LP samples. 5 clusters were identified, and Cluster 2 represents the Ccl21a+Lyve1+ cells. (C) Lyve1+ IF staining.CD4 (green), CD19 (red), Lyve1 (yellow), DAPI (blue). (D) Quantification of (C). Data represent 1 (A-B) or 2 (C-D) independent experiments with 3–5 mice per group. Student’s T test (D) was used. *p<0.05.
Figure 5.
Figure 5.. Mature tertiary lymphoid structures form in response to Hhep colonization.
CRC was induced as in 1A. Colons were harvested 12 weeks post AOM and fixed with PFA prior to staining for IF. (A) IF staining of TLS. CD4 (green), CD19 (red), CD11c (purple), and DAPI (blue). (B) Stitched images of colons from (A) showing numbers and locations of TLS (white arrows) or colonic patches (orange arrows) found in AOM-DSS+/− Hhep. CD4 (green), CD19 (red), CD11c (purple), and DAPI (blue). (C) Quantification of number of TLS per colon of tumor-bearing mice +/− Hhep. Quantification performed at 9- and 12-weeks post AOM. (D) Quantification of intratumoral, peritumoral, and distant TLS in tumor-bearing mice +/− Hhep 12 weeks post AOM. Numbers beneath the pie charts indicate numbers of total tumors analyzed and number of total mice used. Data represent 3–5 independent experiments with 3–5 mice per group. Student’s T test (B) was used. **p<0.005.
Figure 6.
Figure 6.. TLS contain Hhep and Hhep-specific T cells.
CRC was induced as in 1A. Colons were harvested 12 weeks post AOM and fixed with Methacarn. (A-C) or PFA (D) prior to sectioning for IF. (A) FISH staining of TLS using 16S Eubacteria (green) and Hhep (red) specific probes. Yellow indicates co-staining. (B-C) Quantification of percent TLS containing Hhep or bacteria. (D) IF staining of TLS. Shown: CD4 (green), HH5-1tg CD45.1 T cells (orange), CD19 (red), and DAPI (blue). (E) CRC was induced as in 1A but mice were anti-CD19 antibody every 5 days starting on day 58. Shown is the tumor number at 12 weeks. (F) Number of CD4+ T cells and NK cells in the tumors of AOM-DSS+/−Hhep +/−anti-CD19 depleting antibody visualized by immunofluorescence. Data represent 3–5 (A-D) or 2 (E-F) independent experiments with 3–5 mice per group. Student’s T test (B-C) and one way ANOVA (F) were used. *p<0.05, **p<0.005, ****p<0.00005.
Figure 7.
Figure 7.. Hhep-specific Tfh cells are necessary and sufficient to drive TLS formation and control tumor burden.
(A) Bcl6L/LCd4Cre mice were treated with AOM-DSS + Hhep. Some mice received an adoptive transfer of CD45.1+HH5-1 TCR transgenic T cells and tumor number and TLS numbers were assessed at week 12. (B) Colon sections of mice from (A) were stained for CD4 (green), CD19 (red), CD11c (purple), and DAPI (blue) to assess TLS numbers. (C-D) Quantification of TLS (C) or tumor burden (D) of Bcl6L/LCd4Cre mice with or without HH5-1tg T cells adoptively transferred. (E) Tumor stage analysis of TCGA CRC patient data comparing those with a high or low TFH signature. n=96 for TFH low and n=94 for TFH hi. (F) Progression-Free Survival analysis of patients from (E). Data are a composite of 2 independent experiments with 3–5 mice per group (B-D). Error bars represent the mean ± SEM. Student’s t tests (C-D) was used. *p<0.05, ***p<0.0005.

Comment in

References

    1. Ansaldo E, Slayden LC, Ching KL, Koch MA, Wolf NK, Plichta DR, Brown EM, Graham DB, Xavier RJ, Moon JJ, et al. (2019). Akkermansia muciniphila induces intestinal adaptive immune responses during homeostasis. Science 364, 1179–1184. - PMC - PubMed
    1. Arnold M, Sierra MS, Laversanne M, Soerjomataram I, Jemal A, and Bray F (2017). Global patterns and trends in colorectal cancer incidence and mortality. Gut 66, 683–691. - PubMed
    1. Arthur JC, Perez-Chanona E, Mühlbauer M, Tomkovich S, Uronis JM, Fan T-J, Campbell BJ, Abujamel T, Dogan B, Rogers AB, et al. (2012). Intestinal inflammation targets cancer-inducing activity of the microbiota. Science 338, 120–123. - PMC - PubMed
    1. Asaoka Y, Ijichi H, and Koike K (2015). PD-1 Blockade in Tumors with Mismatch-Repair Deficiency. N. Engl. J. Med 373, 1979. - PubMed
    1. Atarashi K, Tanoue T, Ando M, Kamada N, Nagano Y, Narushima S, Suda W, Imaoka A, Setoyama H, Nagamori T, et al. (2015). Th17 cell induction by adhesion of microbes to intestinal epithelial cells. Cell 163, 367–380. - PMC - PubMed

Publication types

MeSH terms

Substances