. 2021 Dec 9;184(25):6081-6100.e26.
doi: 10.1016/j.cell.2021.11.016. Epub 2021 Dec 2.

An NK-like CAR T cell transition in CAR T cell dysfunction

Affiliations

An NK-like CAR T cell transition in CAR T cell dysfunction

Charly R Good et al. Cell. .

Abstract

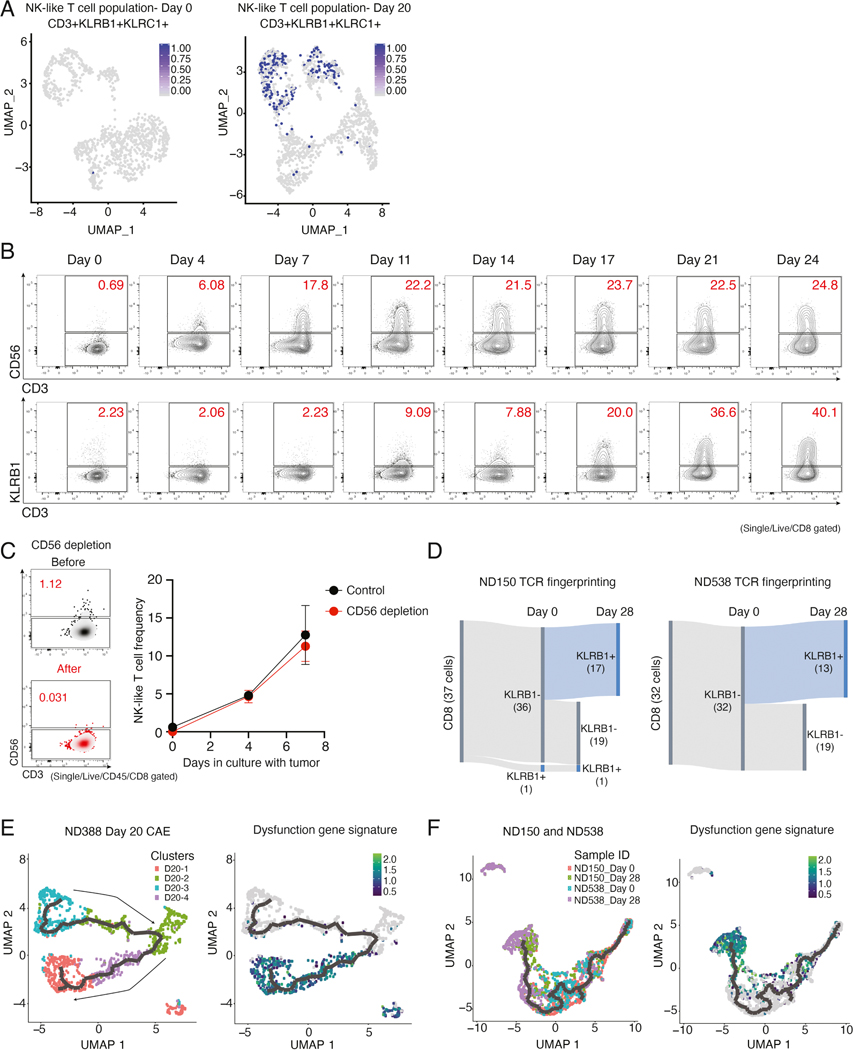
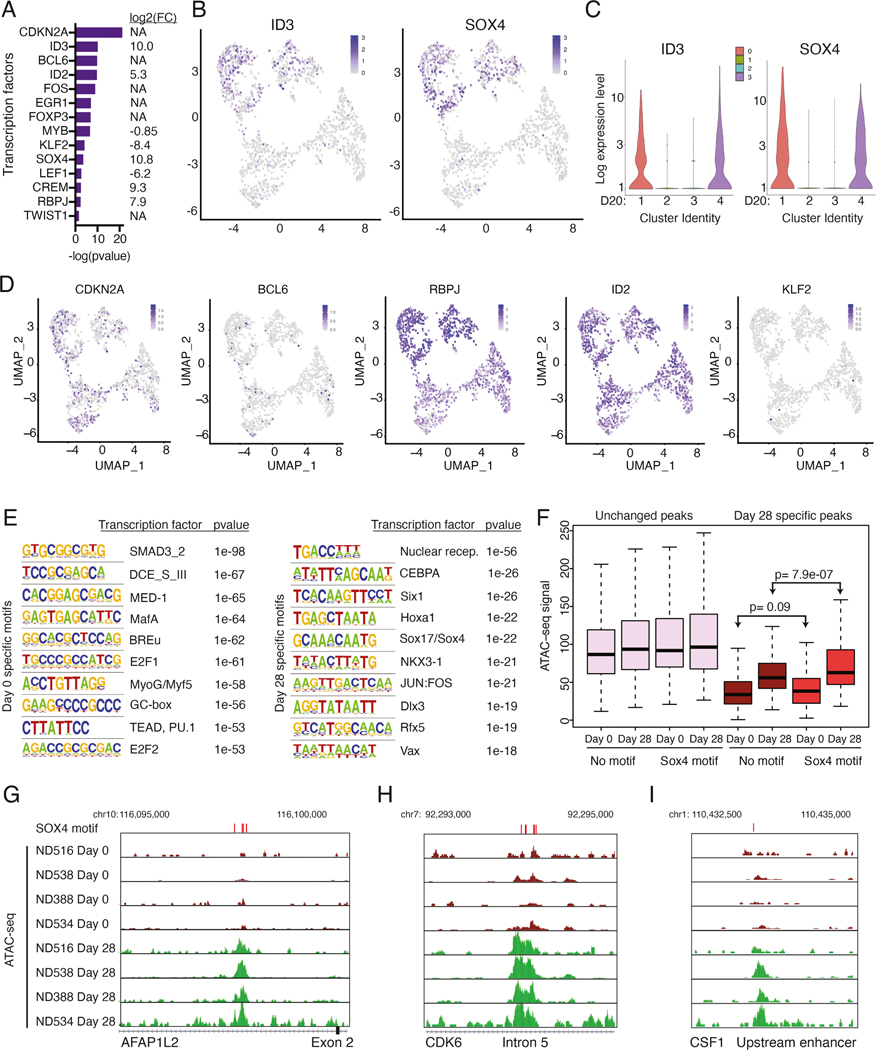
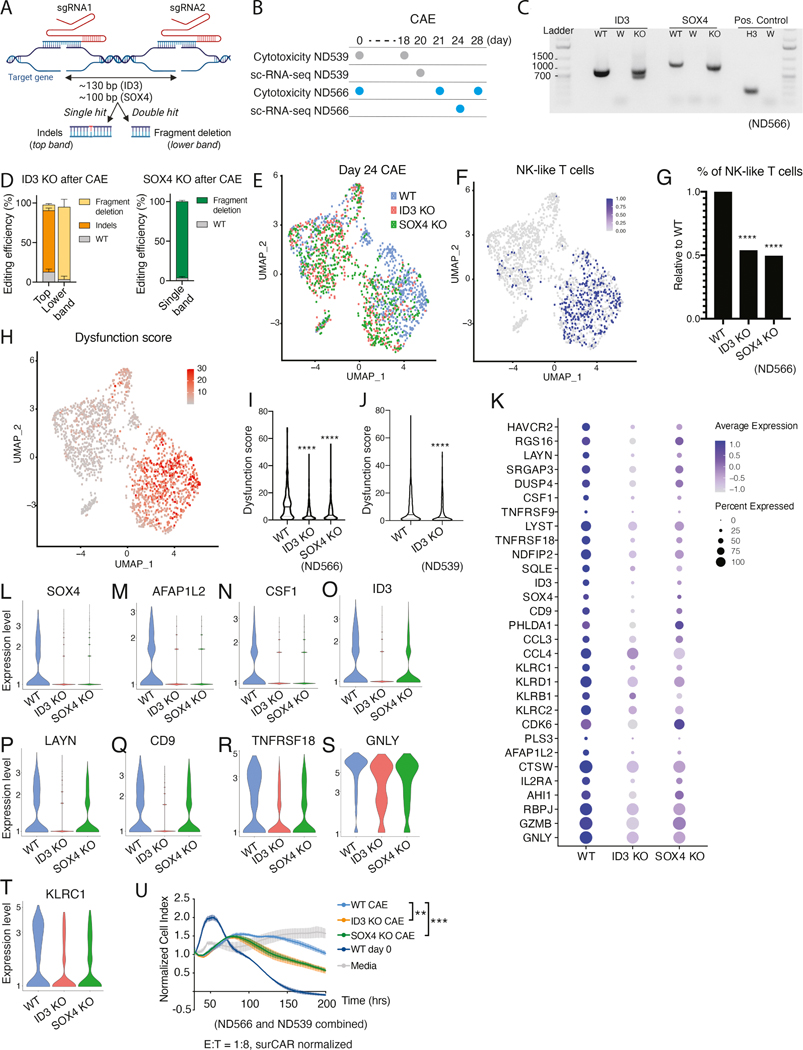
Chimeric antigen receptor (CAR) T cell therapy has achieved remarkable success in hematological malignancies but remains ineffective in solid tumors, due in part to CAR T cell exhaustion in the solid tumor microenvironment. To study dysfunction of mesothelin-redirected CAR T cells in pancreatic cancer, we establish a robust model of continuous antigen exposure that recapitulates hallmark features of T cell exhaustion and discover, both in vitro and in CAR T cell patients, that CAR dysregulation is associated with a CD8+ T-to-NK-like T cell transition. Furthermore, we identify a gene signature defining CAR and TCR dysregulation and transcription factors, including SOX4 and ID3 as key regulators of CAR T cell exhaustion. Our findings shed light on the plasticity of human CAR T cells and demonstrate that genetic downmodulation of ID3 and SOX4 expression can improve the efficacy of CAR T cell therapy in solid tumors by preventing or delaying CAR T cell dysfunction.

Keywords: CAR T cell; ID3; NK-like T cell; SOX4; T cell dysfunction; T cell exhaustion; cancer; cell transfer therapy; immunology; immunotherapy; pancreatic cancer; single-cell RNA-seq.


Conflict of interest statement

Declaration of interests R.M.Y., S.G., S.F.L., S.M.A., M.R., and C.H.J. are inventors on patents and/or patent applications licensed to Novartis Institutes of Biomedical Research and receive license revenue from such licenses. R.M.Y. is an inventor on patents and/or patent applications licensed to Tmunity Therapeutics and receives license revenue from such licenses. C.H.J. is a scientific founder of Tmunity Therapeutics and DeCART Therapeutics, and is a member of the scientific advisory boards of AC Immune, BluesphereBio, Cabaletta, Carisma, Cartography, Cellares, Celldex, Decheng, Poseida, Verismo, WIRB-Copernicus, and Ziopharm. S.J.S. is a consultant, on the scientific advisory board, and receives research support from Genentech/Roche, Novartis, and Juno Therapeutics. S.J.S. is a consultant for AlloGene, AstraZeneca, BeiGene, Regeneron, and Tesa Therapeutics. S.J.S. is a consultant and on the scientific advisory board for Loxo Oncology. S.J.S. is on the scientific advisory board for Nordic Nanovector. S.J.S. is a consultant and receives research support from Celgene. S.F.L. receives research funding from Tmunity Therapeutics and Cabaletta. M.R. is on the scientific advisory board of AbClon Inc. and consulted for BMS, nanoString, GSK, and Bayer. M.R. is the scientific founder of viTToria Biotherapeutics. L.L.L. is on the scientific advisory boards for Alector, Atreca, Dragonfly, DrenBio, Morphosys, Nkarta, Obsidian Therapeutics, Rubius, SBI, and Innovent. S.M.A. receives research funding from Tmunity Therapeutics, RAPT, and Incyte Corporation and is scientific advisor for Trizell, BioArdis, and Verismo.

Figures

Figure 1:
Figure 1:. CAR T cell dysfunction develops during chronic antigenic stimulation with reversible loss of cell surface expression of the CAR in vitro and in patients.
(A) Experimental design of CAR T cell dysfunction in vitro model. (B) Population doubling level of M5CAR transduced T cells during CAE, measured by changes in absolute Epcam-CD45+ counts. Five normal donors (ND) were tested. (C) Time-related changes in surface expression of M5CAR on CD8+ T cells. Data from six donors is shown. (D) Percent of sorted CD8+ CAR+ T cells expressing PD-1 and CTLA-4 during CAE. Two donors are shown. (E) M5CAR T cell lysis of AsPC-1 pancreatic tumor cell line before and after CAE measured by xCelligence as real-time impedance (4:1 E:T ratio). Media and non-specific CD19BBz T cells are used as controls. Data are representative of 4 donors (see Figure S1C). (F) Cytokine profile of CD8+ surCAR pos T cells (day 28 CAE, day 0 product and control CD19BBz) co-cultured with AsPC-1 cells. Significance by two-way ANOVA with Tukey’s post hoc test. Data is shown as mean ± SEM. Two additional donors were tested (see Figure S1I). (G) M5CAR genomic DNA detection in CD8+ surface CAR-positive and -negative T cells (right) during CAE. Data from ND150 is shown. (H) Surface CAR expression on CAE CD8+ CAR T cells before and after rest with IL-15. Data from ND150 is shown. (I) Cell killing capacity of CD8+ M5CAR transduced T cells against AsPC-1 cells after 26 days of CAE before and after 24 hrs of rest with IL-15 (7:1 E:T ratio). Data representative of 2 donors is shown as mean ± SEM (see Figure S2C). Significance by Student’s t test. (J) Surface (top) and intracellular (bottom) M5CAR expression on CD8+ T cells from pleural fluid 36 days post-M5CAR T cell infusion (patient #02916–06). M5CAR FMO is shown as negative control (left). See also Figures S1 and S2.
Figure 2:
Figure 2:. Transcriptional dynamics of dysfunctional CAR T cells.
(A) Differentially expressed genes between day 0 and 28 CAE surCARpos cells. Genes on the right are upregulated at day 28 (N=521) and genes on the left are downregulated (N=517). Red dots indicate significant genes with adjusted p values <0.05 and fold change >2. Analysis includes four biological replicates. (B) Average gene expression values (TPMs) for day 28 surCARpos compared to day 28 surCARneg for differentially expressed genes defined in Figure 2A (top) and all genes (bottom). (C) Ingenuity Pathway Analysis (IPA) of significant genes from 2A. Red denotes NK and blue denotes exhaustion pathways. (D) Normalized RNA-seq counts of representative NK-related genes. Average of four biological replicates with standard deviation depicted. Statistics by Mann-Whitney U test. (E) Heatmap of genes differentially expressed between day 0, 16, and 28 CAE surCARpos cells (N=762 genes). Average of two biological replicates. (F) IPA upstream regulator analysis of transcription factors predicted to regulate the differentially expressed genes between day 0 and 28, ranked by -log(p value). Gene expression log2 FC (day 28/day 0) is shown on the right. Only transcription factors dysregulated upon CAE are shown. (G, H) Representative ATAC-seq tracks (top) and pooled RNA-seq tracks (bottom) from day 0 and 28 samples at ID3 (G) and KLF2 (H) regulatory regions. Analysis includes four biological replicates. See also Figures S3 and S4, Tables S1–S3.
Figure 3:
Figure 3:. Single-cell analysis of CAE CD8+ T cells reveals co-expression of dysfunction signature genes.
UMAP projection of sc-RNA seq data from day 0 product (A) and day 20 CAE cells (B) for donor ND388. (C) Heatmap of top 10 marker genes for each cluster defined in B. (D) Gene ontology determined by metascape pathway analysis for each single-cell cluster from the day 20 CAE sample. Columns are cell clusters (from B) and rows are enriched pathways color coded by level of significance. (E) Volcano plot depicting differentially expressed genes between day 20 CAE clusters 1 and 4 (dysfunctional) and clusters 2 and 3 (non-dysfunctional). Genes upregulated in the dysfunctional clusters are on the right side. Red dots indicate significant genes with p<0.05 and log2FC >0.2. (F) Dot plot illustrating the expression level of dysfunction signature, naïve/memory, cell cycle and control genes in day 0 (left) and day 20 CAE (right), donor ND388. Each column represents one cluster as depicted in A and B. (G) Gene regulatory network analysis (PIDC) for day 20 CAE cells. Columns and rows are the top 500 most variable genes determined by Seurat. Depicted on the right are select genes found within the same community, boxed in red. (H) Normalized counts of CAR transcripts from sc-RNA-seq data for day 20 and 28 CAE cells. Pooled cells from dysfunctional and non-dysfunctional clusters from three CAR T donors. Data shown as mean with standard deviation. Significance by Mann-Whitney U test. (I) Percent of cells that express the CAR transcript in dysfunctional and non-dysfunctional clusters. Average of three CAR T donors. Data shown as mean ±SEM. See also Figures S4, S5, and Tables S4 and S5.
Figure 4:
Figure 4:. In vivo relevance of CAR and TCR T cell dysfunction signature and the NK-like phenotype.
(A) Time-related changes in NK-associated molecules and PD-1 and CD28 on surCARpos and surCARneg CD8+ T cells during CAE. iNKT are defined as cells with Vα24-Jα18 specific TCRs. Data from ND150 is shown. (B) Experimental design of the recurrent AsPC-1 mouse model. (C) AsPC-1 tumor growth volumes in M5CAR T-treated mice. Red arrows indicate tumors analyzed after recurrence. (D) NK-associated molecules expression in CD8 day 0 product (top) and TILs from a representative AsPC-1 recurrent tumor (bottom). (E) Average expression of NK-associated molecules on CD8 T cells in day 0 product and in three recurrent tumors. Each datapoint represents a single mouse for recurrent tumor data and a single technical replicate staining for day 0 product. Color code for mice data is matched with Figure 4C. (F) PD-1, LAG3, and TIM3 expression in CD8 day 0 product (top) and TILs from a representative AsPC-1 recurrent tumor (bottom). (G) Average expression of checkpoint receptors PD-1, LAG3, and TIM3 in CD8 T cells. Each datapoint represents a single mouse for recurrent tumor data and a single technical replicate staining for day 0 product. Color code for mice data is matched with Figure 4C. (H) CD56 expression in CD8+ surCARpos T cells isolated from DLBCL patients at the peak of CTL019 expansion. (I) Expression of NK-associated molecules and PD-1 on CD8+ surCARpos T cells in day 0 product and day 27 peripheral blood T cells from a patient with DLBCL (#13413–39). (J) Timeline showing the experimental design of NY-ESO-1 TIL mouse model. (K) Heatmap of dysfunction signature genes in NY-ESO-1 reactive CD8+ TILs along with blood (CD8+CD45RO+ T cells) and day 0 infused product. See also Figure S6. Data from (E) and (G) is shown as mean ± SEM and significance were assessed by two-way ANOVA plus Sidak test.
Figure 5:
Figure 5:. Transition of CD8+ T cells to NK-like T cells upon continuous antigen stimulation.
(A) NK-like T cell population (CD3+, KLRB1+, and KLRC1) at day 0 (left) and day 20 CAE (right) overlayed on UMAP graphs from Figure 3A and B. (B) Identification of NK-like T cell populations (CD56+ CD3+ and CD3+ KLRB1) during CAE. (C) On left, NK-like T cell frequency (CD3+CD56+) at day 0 and following CD56 depletion. On right, NK-like T cell frequency (CD3+CD56+) with or without CD56 depletion during CAE. Data representative of two donors is shown as mean ± SEM. (D) Single-cell TCR fingerprinting + gene expression analysis in ND150 (left) and ND538 (right). Results are filtered for CD8+ T cells that have the same CDR3 TCR sequence at day 0 and at day 28. Cells were classified as either KLRB1-negative or -positive at day 0 and at day 28 and total number of cells in each category is depicted. (E) Monocle trajectory analysis of ND388 day 20 CAE cells, with single-cell clusters labeled according to their defined clusters in Figure 3B (left). On right, same monocle trajectory but with cells labeled according to expression of the dysfunction gene signature (N= 30 genes, see Figure 3F). (F) Monocle trajectory analysis of ND150 and ND538 day 0 and day 28 CAE cells combined, corresponding to supplemental Figures S5. Cells are labeled according to sample ID (left) or by how highly each cell expresses the dysfunction signature genes (right). See also Figure S6.
Figure 6:
Figure 6:. ID3 and SOX4 are potential regulators of the dysfunction signature.
(A) Select transcription factors predicted to regulate differentially expressed genes between day 0 and day 20 CAE cells in single-cell sequencing datasets, identified using IPA upstream regulator analysis. Depicted are transcription factors that overlap with factors from Figure 2F. On right, gene expression log2 FC (day 20 CAE/day 0) for each transcription factor. NA depicts genes that are not differentially expressed between day 0 and day 20 cells. (B) UMAP plots from Figure 3B showing single-cell transcript levels of ID3 and SOX4 on day 20 CAE cells. Top two clusters are dysfunctional. (C) Violin plots depicting gene expression levels for ID3 and SOX4 for each cluster from day 20 CAE cells (see Figure 3B). (D) Single-cell transcript levels of CDKN2A, BCL6, RBPJ, ID2, and KLF2 illustrated by UMAP plots, corresponding to clusters from Figure 3B (day 20 CAE cells). (E) HOMER motif analysis depicting top 10 enriched transcription factor motifs in bulk ATAC-seq dataset for day 0 samples (left) and day 28 samples (right). Analysis includes four biological replicates. (F) Box plots illustrating the ATAC-seq signal at unchanged peaks (left) and peaks that change between day 0 and day 28 (right). Data are further subdivided depending on whether a SOX4 motif is present. Statistics assessed by Mann-Whitney U test. (G-I) ATAC-seq tracks in regulatory regions at SOX4 motifs from day 0 and 28 CAE samples at dysfunction genes AFAP1L2 (G), CDK6 (H) and CSF1 (I). SOX4 motifs labeled with red bars above tracks. Analysis includes four biological replicates. See also Figures S6 and S7, Table S6.
Figure 7:
Figure 7:. Disruption of ID3 and SOX4 improves CAR T effector function.
(A) Schematic representation of the CRISPR strategy to generate ID3 and SOX4 KO M5CAR T cells. (B) Experimental design for WT, ID3 KO, and SOX4 KO analyses for donors ND566 and ND539. (C) Agarose gel showing ID3 and SOX4 KO detection on cDNA from CD8 sorted populations after CAE for donor ND566. ID3: ID3 PCR, SOX4: SOX4 PCR, Positive Control: histone H3.3, WT: Mock M5CAR, W: water negative control, KO: ID3 KO (in ID3 PCR) and SOX4 KO (in SOX4 PCR). (D) KO quantification of ID3 (ND566 and ND539) and SOX4 (ND566) by cDNA sequencing. Percent indels and fragment deletions upon CAE are shown as mean with standard deviation. (E) UMAP projection of sc-RNA seq data from sorted CD8+ WT, ID3 KO, or SOX4 KO day 24 CAE cells for donor ND566-cells are color coded by KO status. (F) NK-like T cell population at day 24 CAE for donor ND566, depicted by co-expression of CD3, KLRB1, and KLRC1, overlayed on UMAP graphs from Figure 7E. (G) Percentage of NK-like T cells in WT, ID3 KO and SOX4 KO cells, relative to WT (donor ND566). Significance by Fisher’s exact test. (H) UMAP graph from Figure 7E with cells labeled according to expression of the dysfunction gene signature for donor ND566. Dysfunction score for WT, ID3 KO, and SOX4 KO cells for donor ND566 (I) and WT and ID3 KO cells for donor ND539 (J). Significance measured by Mann-Whitney U test. (K) Dot plot illustrating the expression level of dysfunction signature genes in WT, ID3 KO, and SOX4 KO day 24 CAE cells, donor ND566. (L-T) Violin plots depicting gene expression levels from WT, ID3 KO, and SOX4 KO day 24 CAE cells for SOX4 (L), AFAP1L2 (M), CSF1 (N), ID3 (O), LAYN (P), CD9 (Q), TNFRSF18 (R), GNLY (S) and KLRC1 (T) for donor ND566. (U) Cell killing capacity of WT, ID3 KO, and SOX4 KO M5CAR T CAE cells, with controls media alone and day 0 CAR T product. Cells were collected and seeded at 1:8 E:T ratio with AsPC-1 on day 18 (ND539) and day 21 (ND566). Data is presented as mean ± SEM. Significance by two-way ANOVA with Geisser-Greenhouse correction and Dunnet’s post hoc test. See also Figure S7.

Comment in

References

    1. Abd Hamid M, Wang RZ, Yao X, Fan P, Li X, Chang XM, Feng Y, Jones S, Maldonado-Perez D, Waugh C, et al. (2019). Enriched HLA-E and CD94/NKG2A Interaction Limits Antitumor CD8(+) Tumor-Infiltrating T Lymphocyte Responses. Cancer Immunol Res 7, 1293–1306. - PubMed
    1. Agarwal S, Wellhausen N, Levine BL, and June CH (2021). Production of Human CRISPR-Engineered CAR-T Cells. J Vis Exp. - PubMed
    1. Anders S, Pyl PT, and Huber W. (2015). HTSeq--a Python framework to work with high-throughput sequencing data. Bioinformatics 31, 166–169. - PMC - PubMed
    1. Andre P, Denis C, Soulas C, Bourbon-Caillet C, Lopez J, Arnoux T, Blery M, Bonnafous C, Gauthier L, Morel A, et al. (2018). Anti-NKG2A mAb Is a Checkpoint Inhibitor that Promotes Anti-tumor Immunity by Unleashing Both T and NK Cells. Cell 175, 1731–1743.e1713. - PMC - PubMed
    1. Balin SJ, Pellegrini M, Klechevsky E, Won ST, Weiss DI, Choi AW, Hakimian J, Lu J, Ochoa MT, Bloom BR, et al. (2018). Human antimicrobial cytotoxic T lymphocytes, defined by NK receptors and antimicrobial proteins, kill intracellular bacteria. Sci Immunol 3. - PMC - PubMed

Publication types