. 2022 Feb 8;6(3):1074-1087.
doi: 10.1182/bloodadvances.2021004816.

Altered fibrin clot structure and dysregulated fibrinolysis contribute to thrombosis risk in severe COVID-19

Affiliations

Altered fibrin clot structure and dysregulated fibrinolysis contribute to thrombosis risk in severe COVID-19

Malgorzata Wygrecka et al. Blood Adv. .

Abstract

The high incidence of thrombotic events suggests a possible role of the contact system pathway in COVID-19 pathology. In this study, we determined the altered levels of factor XII (FXII) and its activation products in critically ill patients with COVID-19 in comparison with patients with severe acute respiratory distress syndrome related to the influenza virus (acute respiratory distress syndrome [ARDS]-influenza). Compatible with those data, we found rapid consumption of FXII in COVID-19 but not in ARDS-influenza plasma. Interestingly, the lag phase in fibrin formation, triggered by the FXII activator kaolin, was not prolonged in COVID-19, as opposed to that in ARDS-influenza. Confocal and electron microscopy showed that increased FXII activation rate, in conjunction with elevated fibrinogen levels, triggered formation of fibrinolysis-resistant, compact clots with thin fibers and small pores in COVID-19. Accordingly, clot lysis was markedly impaired in COVID-19 as opposed to that in ARDS-influenza. Dysregulated fibrinolytic system, as evidenced by elevated levels of thrombin-activatable fibrinolysis inhibitor, tissue-plasminogen activator, and plasminogen activator inhibitor-1 in COVID-19 potentiated this effect. Analysis of lung tissue sections revealed widespread extra- and intravascular compact fibrin deposits in patients with COVID-19. A compact fibrin network structure and dysregulated fibrinolysis may collectively contribute to a high incidence of thrombotic events in COVID-19.


Figures

None
Graphical abstract
Figure 1.
Figure 1.
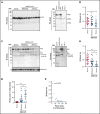
Activation of the contact-phase system in plasma of patients critically ill with COVID-19. (A,C) Western blot analysis (left) of FXII (A) and HK (C) in plasma from patients with moderate or severe COVID-19 (SARS-CoV-2) and donors (healthy subjects). Four of 15 patients with moderate or severe COVID-19 and 3 of 15 donors are represented. Albumin was used as the loading control. The specificity of the antibodies used is shown (right). (B,D) Densitometric analysis of panels A and C, respectively. COVID-19 moderate/severe, n = 15; donor n = 15. (E) PKa-like activity in plasma of patients with moderate (n = 14) or severe (n = 14) COVID-19 and donors (n = 15). (F) Correlation between the levels of intact HK and PKa-like activity in plasma of patients with severe COVID-19 (n = 14). Correlation was performed according to Spearman’s rank correlation coefficient. *P < .05; **P < .01; ***P < .001.
Figure 2.
Figure 2.
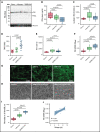
Formation of dense fibrin clots in plasma of patients with severe COVID-19. (A) Western blot analysis of factor XII in plasma of patients with ARDS-influenza (Influenza) or COVID-19 (SARS-CoV-2), as well as donors. Data from 4 of 21 patients with COVID-19, 4 of 25 patients with ARDS-influenza, and 3 of 21 donors are shown. Albumin was used as the loading control. (B) FXII levels in plasma of patients with ARDS-influenza (n = 25) or COVID-19 (n = 21) and donors (n = 16) as assessed by enzyme-linked immunosorbent assay. (C) Lag phase in fibrin formation triggered by kaolin. Influenza, n = 19; SARS-CoV-2, n = 20; donor, n = 20. (D) FVIII activity (FVIII:C) in plasma of patients and donors. Influenza, n = 19; SARS-CoV-2, n = 20; donor, n = 20. (E-F) Time to reach the turbidity peak (E) and maximum (Max) turbidity (F) values for influenza (n = 19), SARS-CoV-2 (n = 20), and donor (n = 20) plasma. Clot formation was induced by the addition of kaolin to plasma. (G) Representative laser scanning confocal microscopy images of fibrin fibers in clots formed from influenza (n = 19), SARS-CoV-2 (n = 20), and donor (n = 20) plasma. Fibrin fibers were stained with an anti-fibrinogen/fibrin antibody followed by an Alexa Fluor 488-conjugated secondary antibody. (H) Representative scanning electron microscopy images of fibrin network in clots generated from influenza plasma (n = 5) as well as low- and high-fibrinogen SARS-CoV-2 (n = 5 per group) plasma. (I) Fibrin fiber density in donor (n = 20), ARDS-influenza (n = 19), and COVID-19 (n = 20) clots. From each patient, 3 separate clots were prepared, 5 images were taken in different areas of the clots, and fibril density was determined in all images. (J) Correlation between maximum turbidity values and fibrinogen levels in plasma of patients with COVID-19 (n = 15; those patients with available fibrinogen levels were included into the analysis). Correlation was performed according to Spearman’s rank correlation coefficient.
Figure 3.
Figure 3.
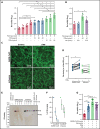
Impact of FXIIa on fibrin clot structure in plasma from patients with severe COVID-19. (A-B) Maximum turbidity values of fibrin clots generated in the purified system from increasing concentrations of fibrinogen and/or FXII/FXIIa, in the absence or presence of CTI. Clot formation was induced by thrombin (n = 4-5). (C) Representative laser scanning confocal microscopy images of fibrin fibers in clots formed from FXII-depleted SARS-CoV-2 or influenza plasma supplemented with FXII. Fibrin fibers were stained with an anti-fibrinogen/fibrin antibody followed by an Alexa Fluor 488-conjugated secondary antibody. (D) Fibrin fiber density in ARDS-influenza (n = 10) and COVID-19 (n = 10) clots generated in panel C. Per patient, 3 separate clots were prepared, 5 images were taken in different areas of the clots, and fibril density was determined in all images. Interconnections of paired data are shown. (E) Rate of FXII autoactivation in ARDS-influenza and SARS-CoV-2 plasma. FXII was added to FXII-depleted plasma, and its decay was monitored by Western blot assay, with an antibody directed against FXII. A representative blot is shown. (F) Quantification of FXII decay in ARDS-influenza and SARS-CoV-2 plasma in panel E. FXII signal at time point 0 was considered to be 100% (n = 20 per group). (G) Maximum turbidity values of fibrin clots generated by the addition of batroxobin to hirudin-preincubated plasma in the presence of FXIIa and/or CTI (n = 15 biological replicates). *P < .05; **P < .01; ***P < .001.
Figure 4.
Figure 4.
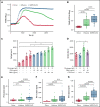
Dysregulated fibrinolysis in severe COVID-19. (A) Turbidimetric analysis of clot lysis in severe COVID-19, ARDS-influenza, and donor plasma. Representative clot lysis curves are shown. SARS-CoV-2, n = 20; ARDS-influenza; n = 19, donors, n = 20. (B) Turbidity values of the fibrin clots at 60 minutes. SARS-CoV-2, n = 20; ARDS-influenza, n = 19; donors, n = 20. (C-D) Clot lysis time. Clots were generated in a purified system with increasing concentrations of fibrinogen and/or FXII/FXIIa. Clot formation was induced by thrombin and clot lysis by plasmin generated from plasminogen by tPA. In some experiments, FXII was preincubated with CTI. Clot formation and lysis were monitored via turbidimetry (n = 3-5). (E-G) tPA (E), plasminogen activator inhibitor-1 (PAI-1; F), and thrombin-activatable fibrinolysis inhibitor (TAFI; G) levels in plasma of patients with COVID-19 (n = 21) or ARDS-influenza (n = 21) and donors (n = 17), as assessed by enzyme-linked immunosorbent assay. *P < .05; **P < .01.
Figure 5.
Figure 5.
High abundance of fibrin deposits in the lungs of patients with severe COVID-19. (A-B) Fibrin (red) accumulation in postmortem lung tissue sections of patients with severe COVID-19 or ARDS-influenza and donors (n = 5/group). Time from death to autopsy was matched for all groups examined. Bar represents 100 µm. (B) Randomly chosen high-magnification images of the COVID-19 and ARDS-influenza clots presented in panel A. Arrows indicate fibrin deposits. All patients available are represented. Fibrin fibers were stained with an anti-fibrinogen/fibrin antibody and then developed by incubation with fast red dye. (C) Fibrin abundance in COVID-19, ARDS-influenza, and donor lungs. From each patient, 5 images were obtained in different areas of the lung, and the percentage of total area was determined in all images (n = 5 per group). *P < .05; **P < .01. (D) Fibrin fiber density in COVID-19 and ARDS-influenza lungs. From each patient, 5 images of fibrin deposits were taken, and fibril density was determined in all of them (n = 5 per group).

References

    1. Coronaviridae Study Group of the International Committee on Taxonomy of Viruses. The species severe acute respiratory syndrome-related coronavirus: classifying 2019-nCoV and naming it SARS-CoV-2. Nat Microbiol. 2020;5;536-544. - PMC - PubMed
    1. Huang C, Wang Y, Li X, et al. . Clinical features of patients infected with 2019 novel coronavirus in Wuhan, China. Lancet. 2020;395(10223): 497-506. - PMC - PubMed
    1. Wu F, Zhao S, Yu B, et al. . A new coronavirus associated with human respiratory disease in China [published correction appears in Nature. 2020;580:E7]. Nature. 2020;579(7798):265-269. - PMC - PubMed
    1. McFadyen JD, Stevens H, Peter K. The emerging threat of (micro)thrombosis in COVID-19 and its therapeutic implications. Circ Res. 2020; 127(4):571-587. - PMC - PubMed
    1. Varga Z, Flammer AJ, Steiger P, et al. . Endothelial cell infection and endotheliitis in COVID-19. Lancet. 2020;395(10234):1417-1418. - PMC - PubMed

Publication types