. 2021 Dec 4;9(1):238.
doi: 10.1186/s40168-021-01159-x.

Clean room microbiome complexity impacts planetary protection bioburden

Affiliations

Clean room microbiome complexity impacts planetary protection bioburden

Ryan Hendrickson et al. Microbiome. .

Abstract

Background: The Spacecraft Assembly Facility (SAF) at the NASA's Jet Propulsion Laboratory is the primary cleanroom facility used in the construction of some of the planetary protection (PP)-sensitive missions developed by NASA, including the Mars 2020 Perseverance Rover that launched in July 2020. SAF floor samples (n=98) were collected, over a 6-month period in 2016 prior to the construction of the Mars rover subsystems, to better understand the temporal and spatial distribution of bacterial populations (total, viable, cultivable, and spore) in this unique cleanroom.

Results: Cleanroom samples were examined for total (living and dead) and viable (living only) microbial populations using molecular approaches and cultured isolates employing the traditional NASA standard spore assay (NSA), which predominantly isolated spores. The 130 NSA isolates were represented by 16 bacterial genera, of which 97% were identified as spore-formers via Sanger sequencing. The most spatially abundant isolate was Bacillus subtilis, and the most temporally abundant spore-former was Virgibacillus panthothenticus. The 16S rRNA gene-targeted amplicon sequencing detected 51 additional genera not found in the NSA method. The amplicon sequencing of the samples treated with propidium monoazide (PMA), which would differentiate between viable and dead organisms, revealed a total of 54 genera: 46 viable non-spore forming genera and 8 viable spore forming genera in these samples. The microbial diversity generated by the amplicon sequencing corresponded to ~86% non-spore-formers and ~14% spore-formers. The most common spatially distributed genera were Sphinigobium, Geobacillus, and Bacillus whereas temporally distributed common genera were Acinetobacter, Geobacilllus, and Bacillus. Single-cell genomics detected 6 genera in the sample analyzed, with the most prominent being Acinetobacter.

Conclusion: This study clearly established that detecting spores via NSA does not provide a complete assessment for the cleanliness of spacecraft-associated environments since it failed to detect several PP-relevant genera that were only recovered via molecular methods. This highlights the importance of a methodological paradigm shift to appropriately monitor bioburden in cleanrooms for not only the aeronautical industry but also for pharmaceutical, medical industries, etc., and the need to employ molecular sequencing to complement traditional culture-based assays. Video abstract.


Conflict of interest statement

All other authors declare that they have no competing interests.

Figures

Fig. 1
Fig. 1
Schematic of the dates and locations sampled in the Spacecraft Assembly Facility. A total of 98 samples were collected over a 6-month period from the SAF. The graph is compartmentalized into artificial section based on sample grouping and foot traffic. Each section describes the location number and number of samples collected throughout the study in a gray box. In total, there are 11 sampling dates and 13 sampling locations. The sample collection was carried out between March 2016 and August 2016, and 98 floor samples were collected during 11 sampling time periods in the JPL SAF. Total surface area of the SAF cleanroom is 921.1 m2 with controlled conditions such as temperature (20 ± 4°C), humidity (30 ± 5%), stringent gowning requirements, and weekly cleaning [28]. Although SAF is capable of becoming an ISO-7 (10k) cleanroom, at the time of sampling SAF was certified as an ISO-8 (100k) cleanroom. A maximum measurement of 8287, 0.5 μm particles/ft3 and 159, 5.0 μm particles/ft3 were seen during the 6 months of the study. High traffic area: L1, L6, and L10; low traffic area: L5, L9, and L13. The rest of the locations had moderate traffic due to hardware assembly
Fig. 2
Fig. 2
Sanger sequencing isolates from the NASA standard assay isolates. A Relative abundance of taxa at each location sampled in SAF. Dot size indicates the number of isolates recovered at a given location, while shape indicates whether an isolate was recovered on one sampling date (diamond) or multiple sampling dates (circle). The color of the dot indicates the number of isolates recovered at each location. C Phylogenetic tree of 16S rRNA genes from Spacecraft Assembly Cleanroom isolates. Numbers in parentheses indicate the number of isolates recovered for each species. Four novel (<98.7% sequence similarity) isolates were recovered (SAF Isolates 59, 66, 97, and 147) and are listed with their closest NCBI hit. The tree is based on maximum likelihood analysis and was constructed using FastTree
Fig. 3
Fig. 3
16S rRNA sequencing results (AB). Distribution of A reads and B richness (alpha diversity) of 16S rRNA measured across the 13 SAF locations grouped by PMA treatment. Microbial composition of live vs dead cell communities as determined using PMA treatment (CE). Microbial community beta diversity driven strongly by PMA treatment for C unweighted UniFrac and D weighted UniFrac (PMA- “red” and PMA+ treated “blue” samples). E Heatmap representation of the features (180 out of 1250 total genera) associated with PMA treatment as calculated using the differential abundance measure in Calour with controls labeled for reference. Comparison of microbial community composition between PMA live vs. dead treatment (FG). Robust Aitchison PCA (RPCA) compare between PMA treated (blue) and untreated (red) SAF rooms (circles) and controls (ex) (F). Log-ratio of lowest common ancestor aggregated Pseudomonadales (order) and Bacilli (class) compared by PMA treatment between rooms (light blue) and controls (dark blue) (G). P values obtained from pairwise t tests with Bonferroni multiple comparisons correction
Fig. 4
Fig. 4
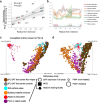
Microbial differentiation across SAF locations differs by radial distance from facility entrance (AB). (x-axes) Linear regression plot of log-ratio of ancestral state predicted sporulating and non-sporulating bacteria (y-axis) by radial distance from entrance (A). Proportion of contribution from AGP and EMP empo-3 sources (y-axis) across radius from entrance (B). Pearson correlation used for linear comparison and error bars represent the standard error of the mean. C Unweighted (C) and weighted (D) microbiome meta-analysis of JPL SAF time series compared to other built environments (JPL SAF 100 swab study, International Space Station, building materials study, abalone rearing facility, NICU hospital study).
Fig. 5
Fig. 5
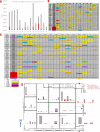
A Total PMA reads per location of genera with greater than 100 total reads across all samples. Genera are described as non-spore(gray), non-NSA spore(red), and NSA(purple). Field Control (FC) and Negative Control (NC) composition are also displayed. B Temporal heatmap of PMA-treated reads of genera with greater than 100 total reads across all samples. Genera are described as non-spore(gray), non-NSA spore(red), and NSA(purple). (◦ = facultative, * = anaerobic) C Spatial heatmap of PMA-treated reads of genera with greater than 100 total reads across all samples. Genera are described as non-spore(gray), non-NSA spore(red), and NSA(purple). D Spatial PMA reads by sampling location. Individual bars represent a single sample collected at a given location. Genera are described as non-spore (gray), non-NSA spore (red), and NSA (purple)
Fig. 6
Fig. 6
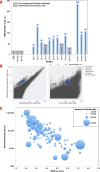
A RSG-positive cells per uL identified in various samples processed with fluorescent-activated cell sorting. B Flow cytometric characteristics and taxonomic affiliations of individual, RedoxSensor Green-positive cells from sample 2016-07-12-1A. C Genome assembly size by whole genome amplification Cp (hours)
Fig. 7
Fig. 7
Venn diagram of identified genera in the three different methodologies used; Sanger sequencing, amplicon sequencing, and single-cell genomics. Purple text indicates NSA spore-formers and red text indicates all non-NSA spore formers

References

    1. Minich JJ, Zhu Q, Janssen S, Hendrickson R, Amir A, Vetter R, et al. KatharoSeq enables high-throughput microbiome analysis from low-biomass samples. mSystems. 2018;3(3). 10.1128/mSystems.00218-17. - PMC - PubMed
    1. Vaishampayan P, Osman S, Andersen G, Venkateswaran K. High-density 16S microarray and clone library-based microbial community composition of the Phoenix spacecraft assembly clean room. Astrobiology. 2010;10(5):499–508. doi: 10.1089/ast.2009.0443. - DOI - PubMed
    1. La Duc MT, Osman S, Vaishampayan P, Piceno Y, Andersen G, Spry JA, et al. Comprehensive census of bacteria in clean rooms by using DNA microarray and cloning methods. Appl Environ Microbiol. 2009;75(20):6559–6567. doi: 10.1128/aem.01073-09. - DOI - PMC - PubMed
    1. Link L, Sawyer J, Venkateswaran K, Nicholson W. Extreme spore UV resistance of Bacillus pumilus isolates obtained from an ultraclean spacecraft assembly facility. Microb Ecol. 2004;47(2):159–163. doi: 10.1007/s00248-003-1029-4. - DOI - PubMed
    1. Venkateswaran K, Satomi M, Chung S, Kern R, Koukol R, Basic C, et al. Molecular microbial diversity of a spacecraft assembly facility. Syst Appl Microbiol. 2001;24(2):311–320. doi: 10.1078/0723-2020-00018. - DOI - PubMed

Publication types

Substances