. 2022 Mar 1;71(3):453-469.
doi: 10.2337/db21-0281.

Nutrient Sensor mTORC1 Regulates Insulin Secretion by Modulating β-Cell Autophagy

Affiliations

Nutrient Sensor mTORC1 Regulates Insulin Secretion by Modulating β-Cell Autophagy

Tal Israeli et al. Diabetes. .

Abstract

The dynamic regulation of autophagy in β-cells by cycles of fasting-feeding and its effects on insulin secretion are unknown. In β-cells, mechanistic target of rapamycin complex 1 (mTORC1) is inhibited while fasting and is rapidly stimulated during refeeding by a single amino acid, leucine, and glucose. Stimulation of mTORC1 by nutrients inhibited the autophagy initiator ULK1 and the transcription factor TFEB, thereby preventing autophagy when β-cells were continuously exposed to nutrients. Inhibition of mTORC1 by Raptor knockout mimicked the effects of fasting and stimulated autophagy while inhibiting insulin secretion, whereas moderate inhibition of autophagy under these conditions rescued insulin secretion. These results show that mTORC1 regulates insulin secretion through modulation of autophagy under different nutritional situations. In the fasting state, autophagy is regulated in an mTORC1-dependent manner, and its stimulation is required to keep insulin levels low, thereby preventing hypoglycemia. Reciprocally, stimulation of mTORC1 by elevated leucine and glucose, which is common in obesity, may promote hyperinsulinemia by inhibiting autophagy.


Figures

Figure 1
Figure 1
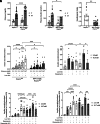
mTORC1 activity during fasting and in response to nutrients. A: C57BL/6 mice were fed or fasted overnight with or without BCAAs added to the drinking water (13.3 g/L each). Islets were isolated and stained for insulin and pS6 (Ser240/244). Scale bar 20 μm. Left panel: percentage Ins+pS6+/Ins+ cells, n = 1,500–2,000 cells per group; pS6 mean fluorescence intensity (MFI) per cell, n = 170–275 cells per group. Right panel: percentage Ins+pS6+/Ins+ cells, n = 900–1,200 cells per group; pS6 MFI per cell, 400–500 cells per group were counted, with n = 2 separate experiments. B: Mice were fasted overnight and then administered 2 g/kg glucose and/or 0.39 g/kg leucine by oral gavage. Pancreases were removed 1 h following gavage and sections stained for insulin and pS6. S6 phosphorylation in β-cells is expressed as percentage of pS6+ β-cells. Scale bar 40 μm. n = 3 separate experiments, with 2,000–3,000 cells per treatment counted. *P < 0.05, **P < 0.01, ***P < 0.001, ****P < 0.0001.
Figure 2
Figure 2
mTORC1 regulation of insulin secretion. AC: Control (Raptorfl/fl) and MIP-CreER; Raptorfl/fl mice were injected with tamoxifen. Two weeks later, mice were fasted overnight and then given 2 g/kg glucose plus 0.39 g/kg leucine by gavage. Blood samples were obtained before and 30 min following the gavage. Plasma glucose measurements (A), serum insulin levels (B), and insulinogenic index calculated as Δinsulin (0–30 min)/Δglucose (0–30 min) ratio (C). Raptorfl/fl n = 16–21 mice; MIP-CreER; Raptorfl/fl n = 16–17 mice. D: Islets were isolated from βRaptor KO and control mice and preincubated in Krebs-Ringer modified buffer (KRB) containing 3.3 mmol/L glucose for 40 min, followed by stimulation with HG (16.7 mmol/L) and/or AAs (leucine plus glutamine 10 mmol/L each), or 2-aminobicyclo-(2,2,1)-heptane-2-carboxylic acid (BCH) (20 mmol/L) for 1 h; n = 5 in triplicates. E: INS-1 cells were preincubated in KRB containing 3.3 mmol/L glucose with or without 100 nmol/L rapamycin for 30 min, followed by incubation in KRB containing 3.3 or 16.7 mmol/L glucose, with or without AAs (leucine plus glutamine 10 mmol/L each) with or without rapamycin (100 nmol/L) for 1 h; n = 4 in triplicates. F and G: Islets (F) and INS-1cells (G) were preincubated in KRB containing 3.3 mmol/L glucose with or without 100 nmol/L rapamycin for 1 h, followed by incubation in KRB containing 3.3 or 16.7 mmol/L glucose with or without AAs (leucine plus glutamine 10 mmol/L each) and 100 nmol/L rapamycin in absence or presence of 250 μmol/L diazoxide and 30 mmol/L potassium chloride (KCl) for 1 h; n = 3 in quadruplicates (islets) or triplicates (INS-1 cells). *P < 0.05, **P < 0.01, ***P < 0.001, ****P < 0.0001.
Figure 3
Figure 3
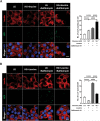
Regulation of β-cell autophagy in the postabsorptive and fed states. A and B: C57BL/6 mice were fasted overnight followed by refeeding for 4 h (A) or treated with BCAA (13.3 g/L each) added to the drinking water (B). Islets were isolated, dispersed, and stained for insulin and LC3. n = 2 separate experiments, with 250–640 cells per group counted. Scale bar 5 μm. C: Mice were fasted overnight and then administered 2 g/kg glucose and/or 0.39 g/kg leucine by gavage, followed 1 h later by removal of pancreases and staining for insulin and LC3. Scale bar 10 μm. n = 3 separate experiments, with 250–450 cells per treatment counted. ****P < 0.0001.
Figure 4
Figure 4
Dynamic regulation of β-cell autophagy by nutrients. A and B: Islets isolated from C57BL/6 mice were incubated for 1 h (A) or overnight (B) in AA-free RPMI medium supplemented with 10% FCS and 3.3 mmol/L glucose (LG) or 16.7 mmol/L glucose plus 10 mmol/L leucine (HG plus leucine) in presence or absence of 100 nmol/L bafilomycin A1 for 2 h. Islets were dispersed and stained for insulin and LC3. Scale bar 10 μm. n = 3 separate experiments, with 120–200 cells per treatment counted. ****P < 0.0001.
Figure 5
Figure 5
mTORC1 regulation of autophagy in β-cells. AC: INS-1 cells were incubated in AA-free RPMI medium supplemented with 3.3 or 16.7 mmol/L glucose with or without leucine plus glutamine (10 mmol/L each) for 1 h, in presence or absence of 100 nmol/L bafilomycin A1 for 4 h. Cells were lysed and analyzed by Western blotting for LC3B, P62/SQSTM1, and GAPDH (A and C) or stained for LC3 (B). Scale bar 10 μm, n = 4, and LC3II/I ratio was quantified in samples treated with bafilomycin A (A); n = 2 separate experiments, and quantification was performed on 500–900 cells per treatment (B); n = 5 (C). D: INS-1 cells were transfected with LC3-GFP-RFP plasmid; medium was changed after 24 h to RPMI containing 16.7 mmol/L glucose with or without leucine plus glutamine (10 mmol/L each) for 4 h. The cells were imaged by confocal microscope, and GFP+ and RFP+ puncta and their colocalization were quantified. The fraction of autophagosomes (GFP+/RFP+ puncta yellow) and autolysosomes (GFP/RFP+ puncta red) is shown at the bottom. Scale bar 5 μm. E: Islets from 12 mice were isolated, pooled, and incubated overnight in complete RPMI. Islets were preincubated at 3.3 mmol/L glucose in absence of AAs and serum and then incubated in medium containing 1% serum and 3.3 mmol/L glucose or 16.7 mmol/L glucose plus 10 mmol/L leucine for 1 h. Islet extracts were analyzed by Western blotting for pULK1 (Ser757), ULK1, pTFEB (Ser122), TFEB, pS6 (Ser240/244), S6, S6K1, TSC1, and GAPDH. F: INS-1 cells were incubated at 3.3 mmol/L glucose or 16.7 mmol/L glucose plus leucine and glutamine for different periods of time followed by Western blotting for phosphorylated (P) and total ULK1, TFEB, S6, and tubulin. Quantifications of pULK1 and pTFEB are shown to the right (n = 3). G: INS-1 cells were transfected with TFEB-GFP construct. After 24 h, the medium was replaced, and the cells were incubated overnight at 3.3 mmol/L or 16.7 mmol/L glucose plus leucine and glutamine (10 mmol/L each). TFEB-GFP localization was analyzed by confocal microscope. Quantification of cells with nuclear localization of TFEB is shown to the right. n = 2 separate experiments, with quantification performed on 35–50 cells per treatment. Scale bar 5 μm. *P < 0.05, ***P < 0.001, ****P < 0.0001. LG, low glucose; NP, nonphosphorylated.
Figure 6
Figure 6
Effects of nutrients on TFEB localization and function in islets. A: Control (Raptorfl/fl) and βRaptor KO (MIP-CreER; Raptorfl/fl) mice were fasted overnight and administered water or 2 g/kg glucose plus 0.39 g/kg leucine by gavage, followed by removal of the pancreas 1 h later. Pancreatic sections were immunostained for insulin and TFEB. Scale bar 10 μm. Analysis was performed by confocal microscope. n = 2 separate experiments, with quantification performed on 400–700 cells. B: WT and βRaptor KO islets were incubated in AA-free RPMI supplemented with 1% serum at 3.3 mmol/L glucose or 16.7 mmol/L glucose plus 10 mmol/L leucine for 24 h. Islets were dispersed, and TFEB localization was analyzed by fluorescence microscope. Scale bar 100 μm. Quantification of the number of cells with cytoplasmic aggregates (A) of TFEB versus diffuse puncta (DP) is shown. n = 2–3 experiments, with 1,000–2,060 cells counted for each experimental group. C: Islets were isolated from control and βRaptor KO mice followed by RNA extraction and quantitative PCR (qPCR) for TFEB-regulated genes. n = 3. D: Islets isolated from control mice were incubated overnight with AA-free RPMI medium at 3.3 mmol/L glucose or 16.7 mmol/L glucose plus 10 mmol/L leucine followed by qPCR for TFEB-regulated genes. n = 3. *P < 0.05, ****P < 0.0001.
Figure 7
Figure 7
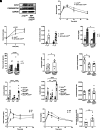
Regulation of insulin secretion by autophagy. Islets were isolated from control (Raptorfl/fl or Atg7+/fl), βAtg7+/− (MIP-CreER; Atg7fl/+), βRaptor KO (MIP-CreER; Raptorfl/fl), and βRaptor KO; Atg7+/− mice (MIP-CreER; Raptorfl/fl; Atg7fl/+) were injected with tamoxifen; metabolic tests were performed after 2 weeks. A: Western blotting for ATG7, P62/SQSTM1, and GAPDH. n = 2. BC: i.p. glucose tolerance test (IPGTT) (B) and glucose-stimulated insulin secretion test (C). n = 15–16 mice per group. D: Insulin secretion of MIP-CreER, Atg7+/fl compared with control (Atg7fl/+) mice was assessed by static incubations at 3.3 and 16.7 mmol/L glucose for 1 h. n = 3. EG: MIP-CreER; Raptorfl/fl and MIP-CreER; Raptorfl/fl; Atg7fl/+ mice were injected with tamoxifen. Two weeks later, mice were fasted overnight and received 2 g/kg glucose plus 0.39 g/kg leucine by gavage. Blood samples were obtained before and 30 min following the gavage: plasma glucose measurements (E), serum insulin levels (F), and the insulinogenic index calculated as Δinsulin (0–30 min)/Δglucose (0–30 min) ratio (G). n = 9–16 mice per group. HJ: Insulin secretion of (Raptorfl/fl), βRaptor−/− and βRaptor−/−; Atg7+/− KO islets was assessed by static incubations at 3.3 and 16.7 mmol/L glucose for 1 h: insulin content (H), secreted insulin (left) and insulin secretion normalized to content (right) (I), and proinsulin/insulin ratio in islet extracts (J). n = 3. K and L: C57BL/6 mice were injected with PBS or 5 μg/kg CQ for 3 consecutive days, followed by IPGTT. Blood samples were drawn at the indicated time points and analyzed for glucose (K) and insulin (L). n = 8. *P < 0.05, **P < 0.01, ****P < 0.0001.
Figure 8
Figure 8
Effects of nutrients, rapamycin, and CQ on mTORC1 signaling and insulin secretion in human islets. AD: Islets were incubated overnight at 3.3 mmol/L glucose and 16.7 mmol/L glucose with or without leucine (10 mmol/L) and/or rapamycin (10 and 100 nmol/L) and/or CQ (10 μmol/L). Western blotting for total and phosphorylated S6, 4EBP1 and TFEB, and for phosphorylated ULK1 (A) and cumulative secretion to the medium (B), insulin content (C), and acute GSIS (D) assessed by static incubations after overnight exposure to the indicated treatments. Results are the means of three independent experiments on islets from three different donors. E: Model depicting the regulation of insulin secretion by nutrient modulation of mTORC1-autophagy crosstalk. Leucine is an amplifier of insulin secretion in presence of metabolic fuels such as glucose and glutamine. Exposure to HG and leucine stimulates mTORC1, which in turn inhibits autophagy, with subsequent augmentation of insulin secretion. In the fasting state, mTORC1 is inhibited, thereby stimulating autophagy, which in turn restrains insulin secretion. Periodic feeding leads to parallel transient stimulation of mTORC1 and autophagy, whereas prolonged exposure to nutrients (leucine and glucose) inhibits autophagy, with subsequent development of hyperinsulinemia. *P < 0.05, ***P < 0.001, ****P < 0.0001. LG, low glucose.

References

    1. Mizushima N. Autophagy in protein and organelle turnover. Cold Spring Harb Symp Quant Biol 2011;76:397–402 - PubMed
    1. Jung HS, Chung KW, Won Kim J, et al. . Loss of autophagy diminishes pancreatic beta cell mass and function with resultant hyperglycemia. Cell Metab 2008;8:318–324 - PubMed
    1. Ebato C, Uchida T, Arakawa M, et al. . Autophagy is important in islet homeostasis and compensatory increase of beta cell mass in response to high-fat diet. Cell Metab 2008;8:325–332 - PubMed
    1. Kim J, Cheon H, Jeong YT, et al. . Amyloidogenic peptide oligomer accumulation in autophagy-deficient β cells induces diabetes. J Clin Invest 2014;124:3311–3324 - PMC - PubMed
    1. Rivera JF, Costes S, Gurlo T, Glabe CG, Butler PC. Autophagy defends pancreatic β cells from human islet amyloid polypeptide-induced toxicity. J Clin Invest 2014;124:3489–3500 - PMC - PubMed

Publication types

MeSH terms