

Persistence of ctDNA in Patients with Breast Cancer During Neoadjuvant Treatment Is a Significant Predictor of Poor Tumor Response
- PMID: 34862246
- PMCID: PMC9377752
- DOI: 10.1158/1078-0432.CCR-21-3231
Persistence of ctDNA in Patients with Breast Cancer During Neoadjuvant Treatment Is a Significant Predictor of Poor Tumor Response
Abstract
Purpose: Accurate response assessment during neoadjuvant systemic treatment (NST) poses a clinical challenge. Therefore, a minimally invasive assessment of tumor response based on cell-free circulating tumor DNA (ctDNA) may be beneficial to guide treatment decisions.
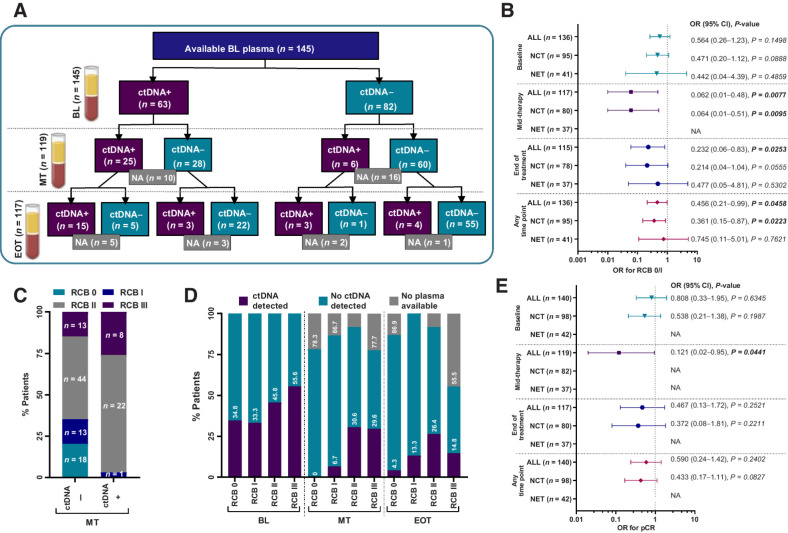
Experimental design: We profiled 93 genes in tissue from 193 patients with early breast cancer. Patient-specific assays were designed for 145 patients to track ctDNA during NST in plasma. ctDNA presence and levels were correlated with complete pathological response (pCR) and residual cancer burden (RCB) as well as clinicopathologic characteristics of the tumor to identify potential proxies for ctDNA release.
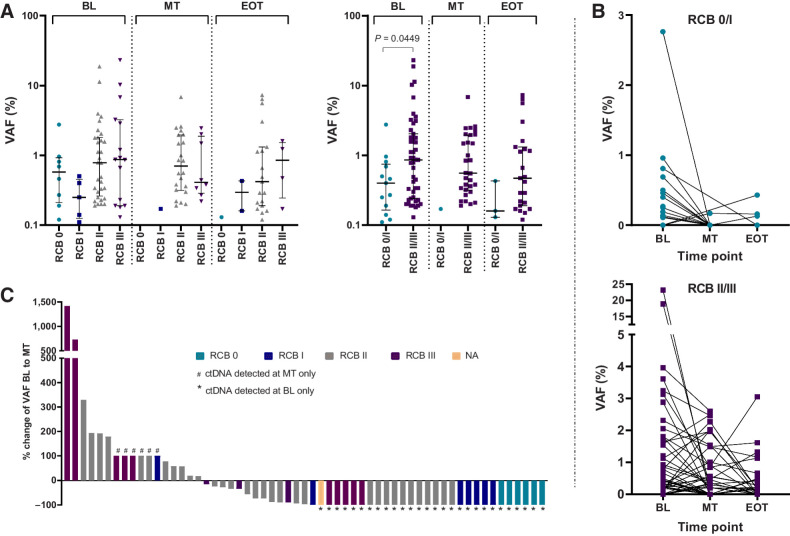
Results: At baseline, ctDNA could be detected in 63/145 (43.4%) patients and persisted in 25/63 (39.7%) patients at mid-therapy (MT) and 15/63 (23.8%) patients at the end of treatment. ctDNA detection at MT was significantly associated with higher RCB (OR = 0.062; 95% CI, 0.01-0.48; P = 0.0077). Of 31 patients with detectable ctDNA at MT, 30 patients (96.8%) were nonresponders (RCB II, n = 8; RCB III, n = 22) and only one patient responded to the treatment (RCB I). Considering all 145 patients with baseline (BL) plasma, none of the patients with RCB 0 and only 6.7% of patients with RCB I had ctDNA detectable at MT, whereas 30.6% and 29.6% of patients with RCB II/III, respectively, had a positive ctDNA result.
Conclusions: Overall, our results demonstrate that the detection and persistence of ctDNA at MT may have the potential to negatively predict response to neoadjuvant treatment and identify patients who will not achieve pCR or be classified with RCB II/III.
©2021 The Authors; Published by the American Association for Cancer Research.
Figures


Similar articles
-
Circulating tumor DNA association with residual cancer burden after neoadjuvant chemotherapy in triple-negative breast cancer in TBCRC 030.Ann Oncol. 2023 Oct;34(10):899-906. doi: 10.1016/j.annonc.2023.08.004. Epub 2023 Aug 18. Ann Oncol. 2023. PMID: 37597579 Free PMC article.
-
Prognostic Value of Residual Disease after Neoadjuvant Therapy in HER2-Positive Breast Cancer Evaluated by Residual Cancer Burden, Neoadjuvant Response Index, and Neo-Bioscore.Clin Cancer Res. 2019 Aug 15;25(16):4985-4992. doi: 10.1158/1078-0432.CCR-19-0560. Epub 2019 May 10. Clin Cancer Res. 2019. PMID: 31076546
-
Evaluation of Therapeutic Target Gene Expression Based on Residual Cancer Burden Classification After Neoadjuvant Chemotherapy for HER2-Negative Breast Cancer.Clin Breast Cancer. 2020 Apr;20(2):117-124.e4. doi: 10.1016/j.clbc.2019.07.001. Epub 2019 Sep 9. Clin Breast Cancer. 2020. PMID: 31570267
-
Circulating tumor DNA in neoadjuvant-treated breast cancer reflects response and survival.Ann Oncol. 2021 Feb;32(2):229-239. doi: 10.1016/j.annonc.2020.11.007. Epub 2020 Nov 21. Ann Oncol. 2021. PMID: 33232761 Free PMC article.
-
Diffuse optical tomography changes correlate with residual cancer burden after neoadjuvant chemotherapy in breast cancer patients.Breast Cancer Res Treat. 2017 Apr;162(3):533-540. doi: 10.1007/s10549-017-4150-7. Epub 2017 Feb 11. Breast Cancer Res Treat. 2017. PMID: 28190249 Free PMC article.
Cited by
-
Circulating Tumor DNA Is a Variant of Liquid Biopsy with Predictive and Prognostic Clinical Value in Breast Cancer Patients.Int J Mol Sci. 2023 Dec 2;24(23):17073. doi: 10.3390/ijms242317073. Int J Mol Sci. 2023. PMID: 38069396 Free PMC article. Review.
-
Predictive Biomarkers of Response to Neoadjuvant Chemotherapy in Breast Cancer: Current and Future Perspectives for Precision Medicine.Cancers (Basel). 2022 Aug 11;14(16):3876. doi: 10.3390/cancers14163876. Cancers (Basel). 2022. PMID: 36010869 Free PMC article. Review.
-
Serial Postoperative Circulating Tumor DNA Assessment Has Strong Prognostic Value During Long-Term Follow-Up in Patients With Breast Cancer.JCO Precis Oncol. 2024 Apr;8:e2300456. doi: 10.1200/PO.23.00456. JCO Precis Oncol. 2024. PMID: 38691816 Free PMC article.
-
Utilizing Plasma Circulating Tumor DNA Sequencing for Precision Medicine in the Management of Solid Cancers.Cancer Res Treat. 2023 Apr;55(2):367-384. doi: 10.4143/crt.2023.446. Cancer Res Treat. 2023. PMID: 36915241 Free PMC article.
-
The Role of Cell-Free DNA in Cancer Treatment Decision Making.Cancers (Basel). 2022 Dec 12;14(24):6115. doi: 10.3390/cancers14246115. Cancers (Basel). 2022. PMID: 36551600 Free PMC article. Review.
References
-
- Heil J, Kuerer HM, Pfob A, Rauch G, Sinn HP, Golatta M, et al. . Eliminating the breast cancer surgery paradigm after neoadjuvant systemic therapy: current evidence and future challenges. Ann Oncol 2020;31:61–71. - PubMed
-
- Burstein HJ, Curigliano G, Loibl S, Dubsky P, Gnant M, Poortmans P, et al. . Estimating the benefits of therapy for early-stage breast cancer: the St. Gallen International Consensus Guidelines for the primary therapy of early breast cancer 2019. Ann Oncol 2019;30:1541–57. - PubMed
-
- Cortazar P, Zhang L, Untch M, Mehta K, Costantino JP, Wolmark N, et al. . Pathological complete response and long-term clinical benefit in breast cancer: the CTNeoBC pooled analysis. Lancet 2014;384:164–72. - PubMed
-
- Saura C, Hlauschek D, Oliveira M, Zardavas D, Jallitsch-Halper A, de la Peña L, et al. . Neoadjuvant letrozole plus taselisib versus letrozole plus placebo in postmenopausal women with oestrogen receptor-positive, HER2-negative, early-stage breast cancer (LORELEI): a multicentre, randomised, double-blind, placebo-controlled, phase 2 trial. Lancet Oncol 2019;20:1226–38. - PubMed
Publication types
MeSH terms
Substances
Grants and funding
LinkOut - more resources
Full Text Sources
Medical
