. 2021 Dec 28;118(52):e2109019118.
doi: 10.1073/pnas.2109019118.

Toward a genome sequence for every animal: Where are we now?

Affiliations

Toward a genome sequence for every animal: Where are we now?

Scott Hotaling et al. Proc Natl Acad Sci U S A. .

Abstract

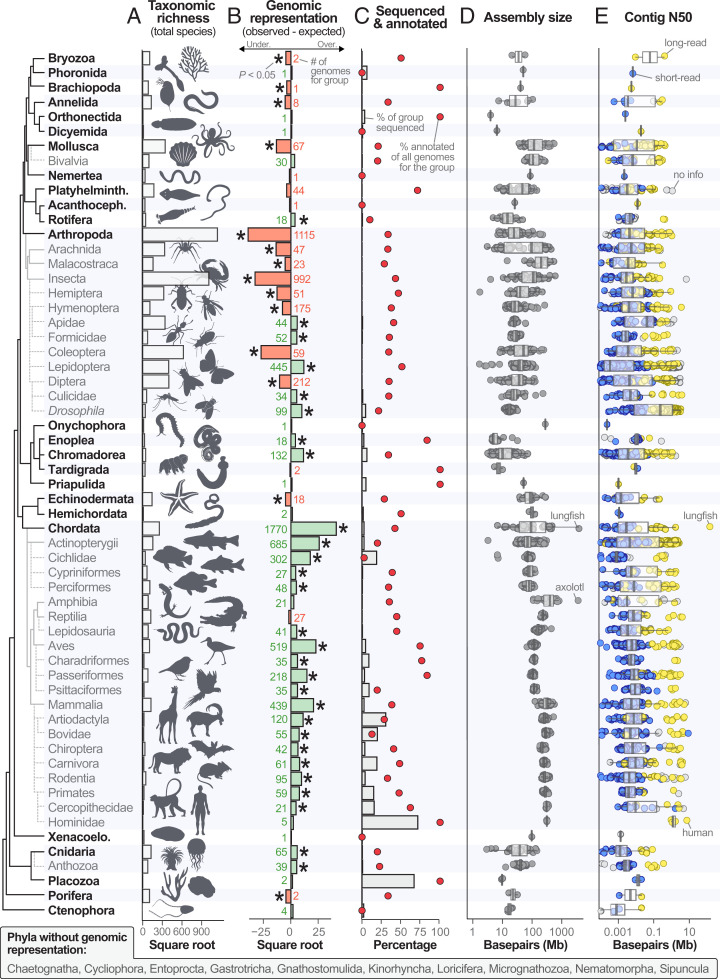
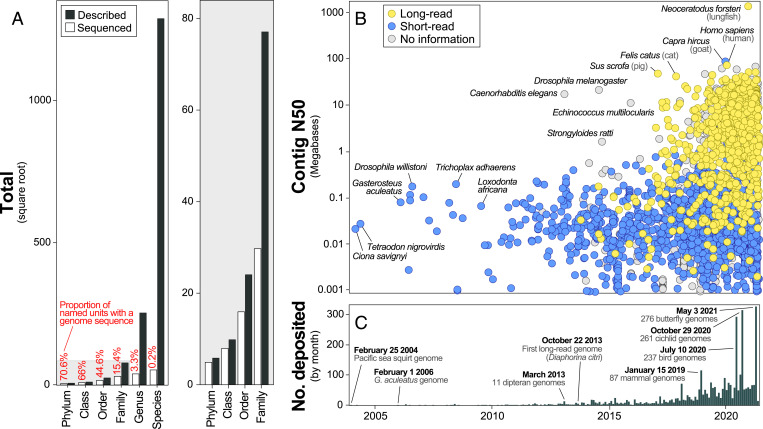
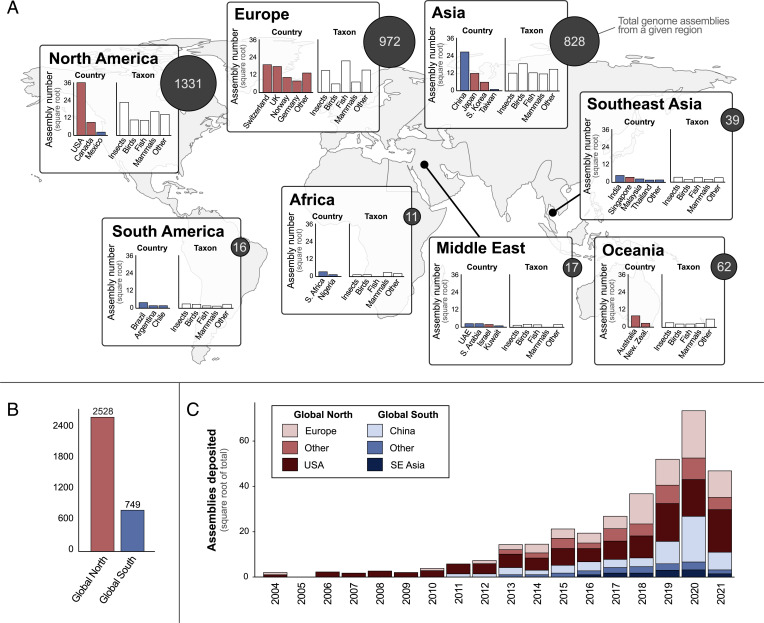
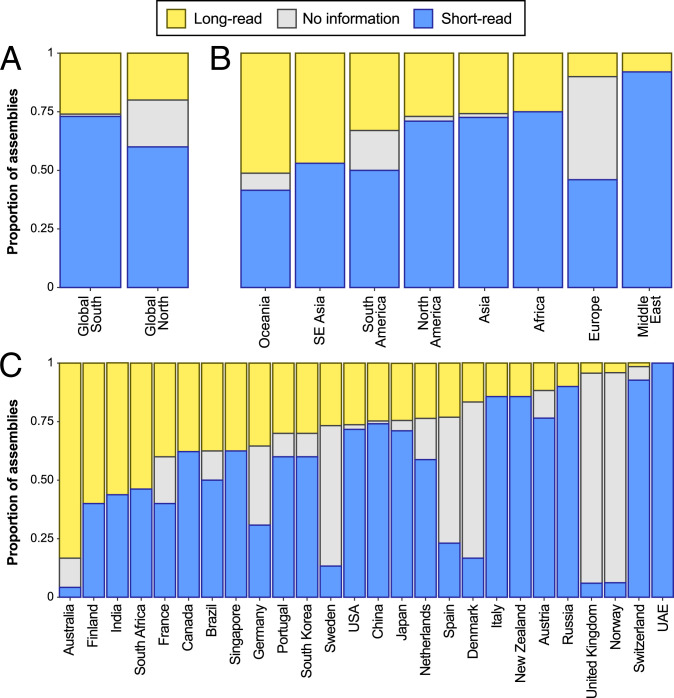
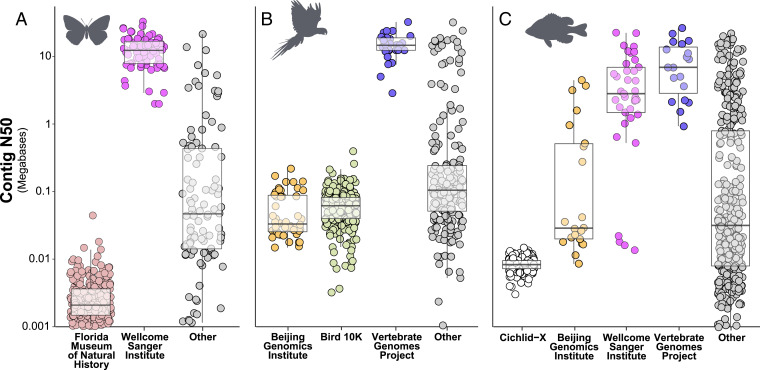
In less than 25 y, the field of animal genome science has transformed from a discipline seeking its first glimpses into genome sequences across the Tree of Life to a global enterprise with ambitions to sequence genomes for all of Earth's eukaryotic diversity [H. A. Lewin et al., Proc. Natl. Acad. Sci. U.S.A. 115, 4325-4333 (2018)]. As the field rapidly moves forward, it is important to take stock of the progress that has been made to best inform the discipline's future. In this Perspective, we provide a contemporary, quantitative overview of animal genome sequencing. We identified the best available genome assemblies in GenBank, the world's most extensive genetic database, for 3,278 unique animal species across 24 phyla. We assessed taxonomic representation, assembly quality, and annotation status for major clades. We show that while tremendous taxonomic progress has occurred, stark disparities in genomic representation exist, highlighted by a systemic overrepresentation of vertebrates and underrepresentation of arthropods. In terms of assembly quality, long-read sequencing has dramatically improved contiguity, whereas gene annotations are available for just 34.3% of taxa. Furthermore, we show that animal genome science has diversified in recent years with an ever-expanding pool of researchers participating. However, the field still appears to be dominated by institutions in the Global North, which have been listed as the submitting institution for 77% of all assemblies. We conclude by offering recommendations for improving genomic resource availability and research value while also broadening global representation.

Keywords: Arthropoda; animal genomes; genome biology; genomic natural history; metazoan.


Conflict of interest statement

The authors declare no competing interest.

Figures

Fig. 1.
Fig. 1.
Variation in taxonomic richness and genome availability, quality, and assembly size across kingdom Animalia in GenBank (as of 28 June 2021). Taxonomic groups are clustered by phylogeny following ref. . Only groups with 30 or more available assemblies as of January 2021 are shown with the exception of Hominidae (n = 5 assemblies). In the tree, bold group names represent phyla and naming conventions follow those of the NCBI database. Of 34 recognized animal phyla, 10 do not have a representative genome sequence. (A) The total number of described species for each group following Zhang (9) and the references therein. (B) Genomic representation among animal groups for 3,278 species with available genome assemblies. Bars represent the magnitude of the observed minus the expected number of genomes given the proportion that each group comprises of described animal diversity. Significance was assessed with Fisher’s exact tests and significantly under- or overrepresented groups (P < 0.05) are denoted with asterisks. Gray numbers indicate the total number of species with available genome assemblies for each group. The number of available assemblies is not mutually exclusive with taxonomy; that is, a carnivore genome assembly would be counted in three categories (order Carnivora, class Mammalia, phylum Chordata). (C) The percentage of described species within a group with an available genome sequence (bars) and the percentage of those assemblies that have corresponding annotations (red circles). For many groups (e.g., arthropods), only a fraction of a percent of all species have an available genome assembly, making their percentage appear near zero. (D) Assembly size for all animal genome assemblies, grouped by taxonomy. (E) Contig N50 by taxonomic group. The sequencing technology used for each assembly is denoted by circle fill color: short-read (blue), long-read (yellow), or not provided (gray). In D and E, each circle represents one genome assembly and a few notable or outlier taxa are indicated with gray text.
Fig. 2.
Fig. 2.
Genome availability for kingdom Animalia versus taxonomic descriptions and over time. (A) The proportion of described taxonomic groups versus the number with sequenced genome assemblies from phyla to species. The gray plot (Right) is a zoomed-in perspective of the higher taxonomy-level categories in the full plot (Left). For genus through phylum, the number of described categories is based on the NCBI taxonomy. For species, the total number described is from Zhang (9). (B) The timeline of genome contiguity versus availability for animals according to the GenBank publication date (x axis; C). A rise in assembly contiguity has been precipitated by long-read sequencing. Particularly contiguous assemblies for a given time period are labeled. (C) The number of animal genome assemblies deposited in GenBank each month since February 2004. Several notable events are labeled. When specific dates are indicated, those (and the assemblies referred to) are included within that month’s total. For B and C, it is important to note that when a genome assembly is updated to a newer version, its associated date is also updated. Thus, the date associated with many early animal assemblies [e.g., C. elegans (1)] has shifted to be more recent with updates.
Fig. 3.
Fig. 3.
Where animal genome assemblies have been produced around the world according to the submitting institutions in GenBank. (A) For each geographic region, total numbers of genome assemblies are shown by dark circles with white lettering. This total is further broken down by country and taxon. For regions where more than four countries have contributed assemblies (e.g., Europe), an “Other” category represents all other countries. The same applies to all assemblies that are not insects, birds, fish, or mammals in the taxon plots. Countries are color-coded by assignment to the Global North or South. (B) The total number of genome assemblies contributed by countries in the Global North (e.g., United States, Europe, Australia) versus the Global South (e.g., Africa, South America, China, Mexico, Middle East). (C) The rate of genome assembly deposition by major sources in the Global North (Europe, United States) and Global South (China, Southeast [SE] Asia) as well as all other countries collectively in each (Other).
Fig. 4.
Fig. 4.
Sequencing technologies used around the world (A) between the Global North versus Global South, (B) among regions, and (C) among countries. To limit bias due to the limited availability of long-read sequencing technologies before ∼2017 (Fig. 2B), only assemblies deposited on or after 1 January 2018 were included in the analysis and in C only countries that deposited five or more assemblies during the focal period (January 2018 to June 2021) are shown.
Fig. 5.
Fig. 5.
Examples of major contributors of genome assemblies for (A) butterflies (order Lepidoptera), (B) birds (class Aves), and (C) fish (primarily class Actinopterygii). Major contributors were defined as any consortium, organization, or project that has deposited more than 5% of all assemblies for butterflies and birds or 2.5% of all assemblies for fish.

References

    1. C. elegans Sequencing Consortium, Genome sequence of the nematode C. elegans: A platform for investigating biology. Science 282, 2012–2018 (1998). - PubMed
    1. Hoencamp C., et al. , 3D genomics across the tree of life reveals condensin II as a determinant of architecture type. Science 372, 984–989 (2021). - PMC - PubMed
    1. Thomas G. W. C., et al. , Gene content evolution in the arthropods. Genome Biol. 21, 15 (2020). - PMC - PubMed
    1. Hotaling S., et al. , Long-reads are revolutionizing 20 years of insect genome sequencing. Genome Biol. Evol. 13, evab138 (2021). - PMC - PubMed
    1. Rhie A., et al. , Towards complete and error-free genome assemblies of all vertebrate species. Nature 592, 737–746 (2021). - PMC - PubMed

Publication types