Observational Study
. 2021 Dec 3;12(1):7065.
doi: 10.1038/s41467-021-26703-z.

A deep learning framework identifies dimensional representations of Alzheimer's Disease from brain structure

Collaborators, Affiliations
Observational Study

A deep learning framework identifies dimensional representations of Alzheimer's Disease from brain structure

Zhijian Yang et al. Nat Commun. .

Abstract

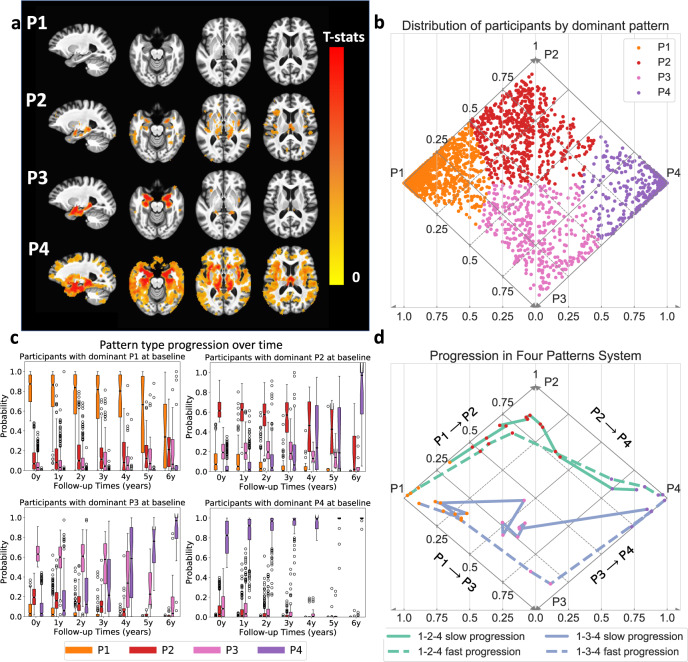
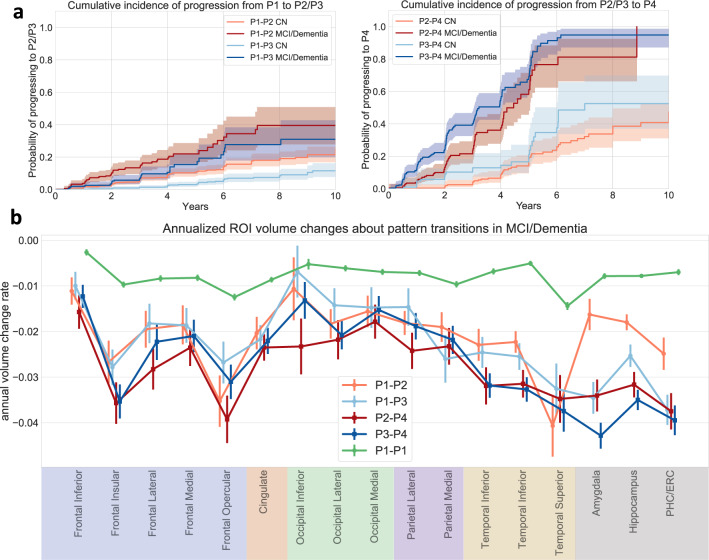
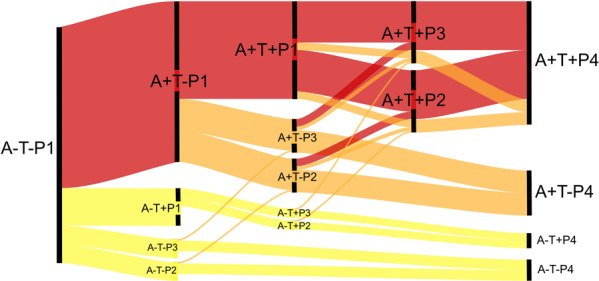
Heterogeneity of brain diseases is a challenge for precision diagnosis/prognosis. We describe and validate Smile-GAN (SeMI-supervised cLustEring-Generative Adversarial Network), a semi-supervised deep-clustering method, which examines neuroanatomical heterogeneity contrasted against normal brain structure, to identify disease subtypes through neuroimaging signatures. When applied to regional volumes derived from T1-weighted MRI (two studies; 2,832 participants; 8,146 scans) including cognitively normal individuals and those with cognitive impairment and dementia, Smile-GAN identified four patterns or axes of neurodegeneration. Applying this framework to longitudinal data revealed two distinct progression pathways. Measures of expression of these patterns predicted the pathway and rate of future neurodegeneration. Pattern expression offered complementary performance to amyloid/tau in predicting clinical progression. These deep-learning derived biomarkers offer potential for precision diagnostics and targeted clinical trial recruitment.


Conflict of interest statement

We disclose here that I.N. served as an educational speaker for Biogen. The remaining authors declare no competing interests

Figures

Fig. 1
Fig. 1. Conceptual overview of Smile-GAN.
Blue lines represent non-disease-related variations observed In both normal control (CN) and patient groups. Red regions represent disease effects which only exist among patient groups. Smile-GAN finds neuroanatomical pattern types by means of clustering transformations from CN data to patient data.
Fig. 2
Fig. 2. Characterization of four atrophy patterns (P1–P4) and two progression pathways of neurodegeneration.
(Data from 899 ADNI2/GO participants in discovery set (a) and all 2832 ADNI/BLSA participants (bd)). a Voxel-wise statistical comparison (one-sided t-test) between CN and participants predominantly belonging to each of the four patterns. False discovery rate (FDR) correction for multiple comparisons with p-value threshold of 0.05 was applied. b Visualization of participants’ expression of four patterns in a diamond plot. Pseudo-probabilities of belonging to each pattern reflect levels of expression (i.e., presence) of respective patterns and probabilistic subtype memberships. Horizontal axis indicates p1 and p4 probabilities and diagonal axes reveal p2 (solid lines) and p3 (dashed lines) probabilities. Since participants never have both P1 and P4 > 0, all observed pattern combinations can be represented in this diamond plot. Dots for individual participants are color coded by the dominant pattern. c Box and whisker plots of expression of the four patterns over time for each baseline pattern group. (center line, median; box limits, upper and lower quartiles; whiskers, 1.5× interquartile range; points, outliers). d Progression paths of four representative participants. Dashed lines show participants reaching P4 from P1 within 5 years and solid lines show those who take more than 10 years to reach P4 from P1. Source data are provided as a Source Data file.
Fig. 3
Fig. 3. Participants grouping and cognitive performance of subgroups.
(Data from 1194 ADNI participants with Abeta/pTau measures) a Number of participants grouped by diagnosis, amyloid status, and pattern. b AT(N) categorization based on participants’ patterns and CSF Abeta/pTau status. Based on patterns, N is classified as normal (P1), not typical of AD (P2), or characteristic of AD (P3/P4). c Box and whisker plots of cognitive performance of MCI/Dementia participants by pattern. (A: Abeta; T: pTau) (center line, median; box limits, upper and lower quartiles; whiskers, 1.5× interquartile range; points, outliers). Source data are provided as a Source Data file.
Fig. 4
Fig. 4. Analysis of longitudinal pattern progression.
(Data from all 2832 ADNI/BLSA participants) a Cumulative incidence of pattern progression. The line styles indicate the diagnosis at baseline. 95% confidence intervals are shown with estimated cumulative incidence curves as centres. b Annual atrophy rate in selected GM regions along different paths. Data within 3 years before pattern change or last follow-up point (for stable P1 participants (P1-P1)) were utilized and random intercept mixed effect model with time as fixed effect was used to derive annual volume change rate with respect to baseline volume. Data are presented as estimated coefficient of time variable ±standard error. (PHC Parahippocampal gyrus, ERC Entorhinal cortex) Source data are provided as a Source Data file.
Fig. 5
Fig. 5. Predictive ability of patterns.
(Data from 1194 ADNI participants with Abeta/pTau measures (a, b, d) and 2832 ADNI/BLSA participants (c)) a Survival curves for neurodegeneration progression to P4; b Survival curves for clinical diagnosis progression from CN to MCI and from MCI to Dementia. For both a and b, survival curves are stratified by both initial dominant pattern and Abeta (A) /pTau (T) status; p-values derived from log-rank tests indicate statistical significance of difference between positive and negative Abeta or pTau status within each pattern; c, d Box and whisker plots of concordance Index (C-Index) which measures the performance of Cox-proportional-hazard model in predicting clinical conversion time (from CN to MCI and MCI to Dementia. Different biomarkers are utilized as features of the model for evaluation of their predictive performance. (Center line, median; box limits, upper and lower quartiles; whiskers, 1.5× interquartile range; points, outliers) Source data are provided as a Source Data file.
Fig. 6
Fig. 6. Prediction of clinical diagnosis progression with composite biomarkers.
Data from 1194 ADNI participants with Abeta/pTau measures. a Biomarkers were added successively into features set based an order of accessibility. Concordance Index (CI) measures the performance of Cox-proportional-hazard model in predicting clinical conversion time (from CN to MCI and MCI to Dementia) Different sets of biomarkers are utilized as features of the model for evaluation of their predictive powers. (Center line, median; box limits, upper and lower quartiles; whiskers, 1.5× interquartile range; points, outliers). b Survival curves stratified by composite scores (A, T, Pattern, ADAS-Cog jointly predicting outcome in cross-validated fashion) for one randomly split validation set. 95% confidence intervals are shown with estimated survival curves as centres. (A: Abeta; T: pTau, P: Pattern, Cog: ADAS-Cog score) Source data are provided as a Source Data file.
Fig. 7
Fig. 7. Hypothetical flow diagram of implications of pattern pathways on the ATN framework.
Cascade of biomarkers can follow a canonical AD pathway, which is the most represented in the ADNI sample (red). The relationships of patterns with amyloid/tau status identifies another large group with the presence of AD pathology and significant or even dominant copathology (orange) as well as groups with suspected non-AD pathology (yellow). These pathways also indicate that certain typical AD neurodegenerative phenotypes may in some cases be driven by copathology. For example, A+T+ nodes are typical for AD; however, there are several potential paths (orange) whereby copathology may be the dominant cause of the neurodegenerative pattern. Path thickness estimates approximate flux through nodes in ADNI. This model is based on distribution of cross-sectional data in A/T/P categories and the assumption that events happen in certain order (A-→A+; T-→T+; P1→P2→P4 and P1→P3→P4).
Fig. 8
Fig. 8. Schematic diagram and network architectures.
a General idea behind Smile-GAN. The model aims to learn several mappings from the CN group to the PT group b Schematic diagram of Smile-GAN. The idea of the model is realized by learning one mapping from joint of two groups X × Z to Y, while learning another function g:YZ. CN cognitive normal control, PT patient, Sub pattern subtype. c Network architecture of three functions: blue arrow represents one linear transformation followed by one leaky rectified linear unit function, green arrow represents one linear transformation followed by one softmax function, red arrow represents only one linear transformation.

References

    1. Lundervold AS, Lundervold A. An overview of deep learning in medical imaging focusing on MRI. Z. Med. Phys. 2019;29:102–127. doi: 10.1016/j.zemedi.2018.11.002. - DOI - PubMed
    1. Arbabshirani MR, Plis S, Sui J, Calhoun VD. Single subject prediction of brain disorders in neuroimaging: Promises and pitfalls. NeuroImage. 2017;145:137–165. doi: 10.1016/j.neuroimage.2016.02.079. - DOI - PMC - PubMed
    1. Resnick SM, et al. One-year age changes in MRI brain volumes in older adults. Cereb. Cortex. 2000;10:464–472. doi: 10.1093/cercor/10.5.464. - DOI - PubMed
    1. Resnick SM, Pham DL, Kraut MA, Zonderman AB, Davatzikos C. Longitudinal magnetic resonance imaging studies of older adults: a shrinking brain. J. Neurosci. 2003;23:295–301. doi: 10.1523/JNEUROSCI.23-08-03295.2003. - DOI - PMC - PubMed
    1. Habes M, et al. The Brain Chart of Aging: Machine-learning analytics reveals links between brain aging, white matter disease, amyloid burden, and cognition in the iSTAGING consortium of 10,216 harmonized MR scans. Alzheimers Dement. 2021;17:89–102. doi: 10.1002/alz.12178. - DOI - PMC - PubMed

Publication types

MeSH terms