. 2021 Dec 3;6(1):103.
doi: 10.1038/s41525-021-00265-x.

Most myopathic lamin variants aggregate: a functional genomics approach for assessing variants of uncertain significance

Affiliations

Most myopathic lamin variants aggregate: a functional genomics approach for assessing variants of uncertain significance

Corey L Anderson et al. NPJ Genom Med. .

Abstract

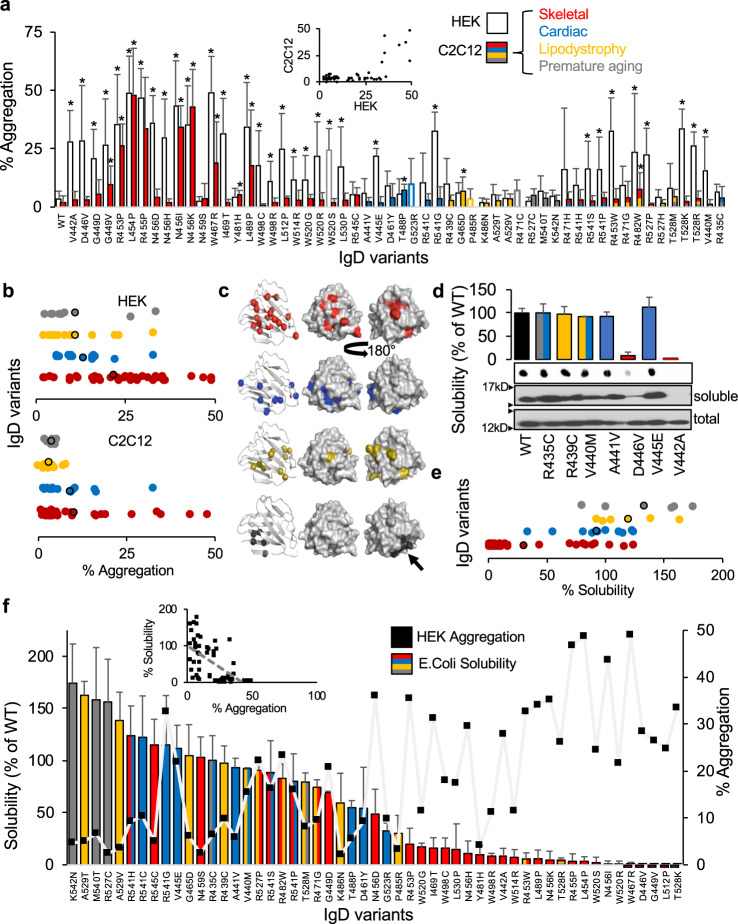
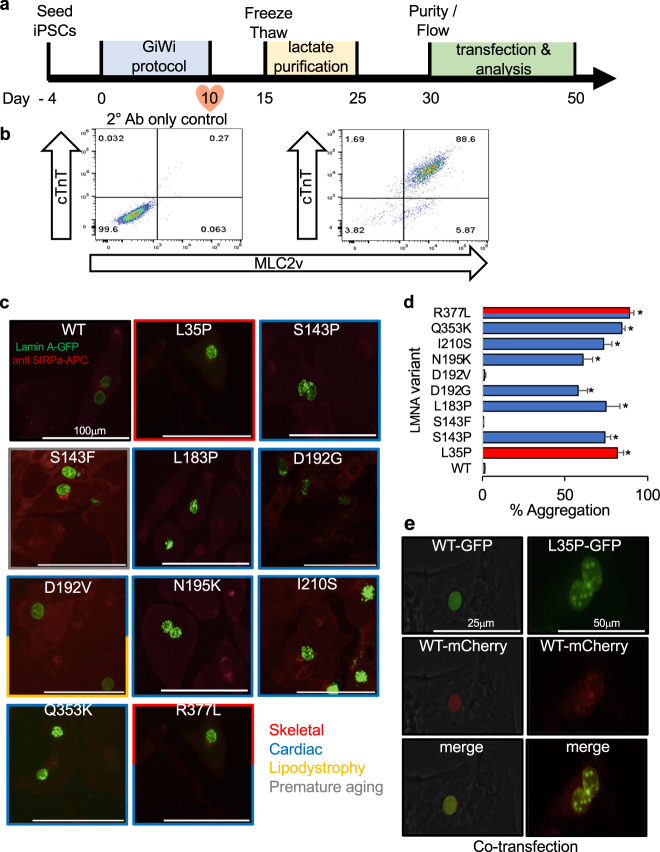
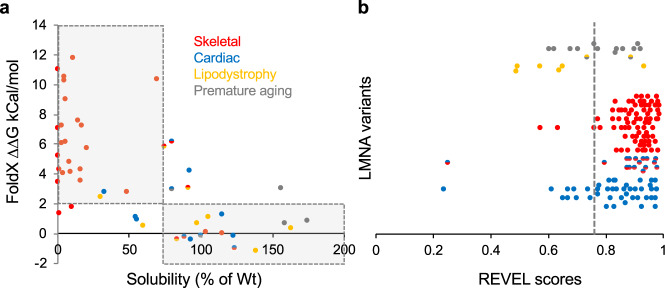
Hundreds of LMNA variants have been associated with several distinct disease phenotypes. However, genotype-phenotype relationships remain largely undefined and the impact for most variants remains unknown. We performed a functional analysis for 178 variants across five structural domains using two different overexpression models. We found that lamin A aggregation is a major determinant for skeletal and cardiac laminopathies. An in vitro solubility assay shows that aggregation-prone variants in the immunoglobulin-like domain correlate with domain destabilization. Finally, we demonstrate that myopathic-associated LMNA variants show aggregation patterns in induced pluripotent stem cell derived-cardiomyocytes (iPSC-CMs) in contrast to non-myopathic LMNA variants. Our data-driven approach (1) reveals that striated muscle laminopathies are predominantly protein misfolding diseases, (2) demonstrates an iPSC-CM experimental platform for characterizing laminopathic variants in human cardiomyocytes, and (3) supports a functional assay to aid in assessing pathogenicity for myopathic variants of uncertain significance.


Conflict of interest statement

T.J.K. serves as a consultant for Fujifilm Cellular Dynamics, which is a stem cell technology company. The other authors declare no other conflict of interests or financial disclosures to declare.

Figures

Fig. 1
Fig. 1. Lamin characterization workflow.
a Schematic of lamin A showing each structural domain and locations of the GFP tag and NLS. Numbers indicate the number of missense variants from Universal Mutational Database studied herein/total number of missense variants in ClinVar (and UMD) for indicated domains. b Sequence variants grouped by their clinical significance are described in ClinVar (linker variants not included). Numbers for each category indicate the number of missense variants we studied/total number of missense variants reported in ClinVar as of July 2021. c Variant library construction. d Representative western blots of full-length lamin A expressed in HEK 293 cells (lamin A (74kD) + GFP (27kD) = 101kD). e Representative images (20 μm scale bar) of L35P nuclear aggregation compared to WT for the three cell types used. f Mapping of the variants to the IgD structure and CCD locations (pink and blue indicate hydrophobic and ionic dimerization interacting residues, respectively and gray indicates variable surface residues. g Solubility (i.e., stability) assay described previously. h Venn diagram showing disease classification for all disease-linked variants studied. i In silico tools used to compare to lamin A variant aggregation results. GFP green fluorescent protein, NLS nuclear localization signal, IgD immunoglobin-like domain, UMD, Universal Mutational Database, VUS variants of uncertain significance, CCD coiled-coil domain, LIC ligation-independent subcloning, HEK human embryonic kidney cells, mouse myoblasts (C2C12), iPSC-CMs induced pluripotent stem cell-induced cardiomyocytes, REVEL Rare Exome Ensemble Learner, genomAD Genome Aggregation Database.
Fig. 2
Fig. 2. Lamin A aggregation for CCD variants.
a Percentage (%) of cells showing lamin A aggregation plotted for each CCD 1A variant (mean ± SD, n ≥ 3). C2C12 myoblast results are color-coded as follows: skeletal disease-associated variants in red, cardiac in blue, lipodystrophy in yellow, progeria in gray. HEK 293 results are plotted in white or outlined in color if C2C12 myoblast values are zero (e.g., gray and blue for A57P). Inset shows the correlation between HEK 293 cells and C2C12 myoblasts. b CCD 1B variants color-coded as above. c % aggregation distribution for all CCD variants grouped by phenotype for HEK 293 cells and C2C12 myoblasts with average values outlined in black. Variants with crossover disease are plotted more than once for each phenotype. d CCD 2A variants color-coded as above. e CCD 2B variants color-coded as above. Asterisks indicate statistically significant increases in aggregation over WT (p < 0.05).
Fig. 3
Fig. 3. Lamin A aggregation for IgD variants.
a Percentage (%) of cells showing lamin A aggregation are plotted for each variant (mean ± SD, n ≥ 3). C2C12 myoblast variants are color-coded as follows: skeletal disease-associated variants in red, cardiac in blue, lipodystrophy in yellow, progeria in gray. HEK 293 results are plotted in white. Inset shows the correlation between HEK 293 cells and C2C12 myoblasts. b % aggregation distribution for all IgD variants grouped by phenotype for HEK 293 cells and C2C12 myoblasts with average values outlined in black. c Variants, color-coded as above, are mapped to regions of the IgD structure by disease (red, blue, yellow, and gray balls). The first structure shows the location of each variant followed by surface representations with the last one rotated 180°. Arrow indicates surface patch where progeria-linked variants are located. d Representative immunoblots for recombinant IgD variants expressed in E. coli. Bars represent relative solubility (% of WT) determined by dot blot for each variant (mean ± SD, n ≥ 3). e Relative solubility distribution (% of WT determined by dot blot) for all IgD variants grouped by phenotype (n ≥ 3) with average values outlined in black. Variants with crossover disease are plotted more than once for each phenotype. f Solubility results plotted along with the HEK 293 aggregation results for comparison with inset showing an inverse relationship between aggregation and solubility. Asterisks indicate statistically significant increases in aggregation over WT (p < 0.05). IgD immunoglobulin-like domain.
Fig. 4
Fig. 4. Lamin A nuclear aggregation in iPSC-CMs.
a A small molecule “GiWi” protocol was used followed by lactate purification to generate (b) ~90% pure iPSC-CMs (cTnT and MLC2v positive). c Representative images of disease-linked lamin A variants (green) overexpressed in SIRPa (cardiomyocyte surface marker) positive cells (red) showing nuclear aggregation. d Bars ± SD represents the % of cells showing aggregation for all variants studied color-coded as above (n ≥ 3). e Representative images of mCherry-WT lamin A (red) co-expressed with GFP-L35P lamin A (green). Asterisks indicate statistically significant increases in aggregation over WT (p < 0.05). GiWi Gsk3 inhibitor: Wnt inhibitor, SIRPa CD47-signal regulatory protein alpha.
Fig. 5
Fig. 5. In silico analysis of LMNA variants.
a Comparison of FoldX and IgD solubility data was reported herein using stability cutoffs of ΔΔG ≤ 2 for FoldX and ≥75% of WT for solubility. The shaded area highlights variants that agree. Color code: cardiac (blue), skeletal (red), lipodystrophy (yellow) and premature aging (gray). b Dot plot showing REVEL score distribution of variants with myopathic disease variants (red and/or blue dots) that are not in the gnomAD control population (137 total) compared to all lipodystrophy and/or progeria variants without myopathic crossover disease (yellow and/or gray dots) (20 total). Some myopathic variants also have lipodystrophy/progeria but were not color-coded for simplicity. Variants above the threshold of 0.76 (dashed line) are considered deleterious. IgD immunoglobulin-like domain.
Fig. 6
Fig. 6. Summary of how our data can support myopathic LMNA variant classification per ACMG guidelines.
Flowchart showing the different ACMG classification criteria and how our data could be incorporated towards classification. PS3 represents functional pathogenic support; the level of which can vary depending on how many of the assays show aggregation. We propose that at least 46 VUS (including those listed as uncertain, not reported, or have conflicting interpretations) meet the criteria for PS3 as they show aggregation in two cell models (Tables S1–S5). The dashed black rectangle for BS3 is to highlight that lack of aggregation is not indicative of benign functional support (particularly for cardiac variants) since there are many other possible pathogenic mechanisms. PP3 and BP4 represent pathogenic and benign computational (REVEL and FoldX) support, respectively with 81 VUS predicted to be pathogenic by REVEL (Tables S1–S5). Lack of variants in the control population from databases like genomAD (PM2) can further strengthen support for the pathogenic classification of LMNA variants in conjunction with the functional and in silico data. ACMG American College of Medical Genetics and Genomics, REVEL Rare Exome Ensemble Learner, genomAD Genome Aggregation Database.

References

    1. Dittmer TA, Misteli T. The lamin protein family. Genome Biol. 2011;12:222. - PMC - PubMed
    1. Worman HJ, Bonne G. “Laminopathies”: a wide spectrum of human diseases. Exp. Cell Res. 2007;313:2121–2133. - PMC - PubMed
    1. Bonne G, et al. Mutations in the gene encoding lamin A/C cause autosomal dominant Emery-Dreifuss muscular dystrophy. Nat. Genet. 1999;21:285–288. - PubMed
    1. Fatkin D, et al. Missense mutations in the rod domain of the lamin A/C gene as causes of dilated cardiomyopathy and conduction-system disease. N. Engl. J. Med. 1999;341:1715–1724. - PubMed
    1. Cao H, Hegele RA. Nuclear lamin A/C R482Q mutation in Canadian kindreds with Dunnigan-type familial partial lipodystrophy. Hum. Mol. Genet. 2000;9:109–112. - PubMed