. 2021 Dec 3;11(1):23403.
doi: 10.1038/s41598-021-02560-0.

Modulation of magnetoencephalography alpha band activity by radiofrequency electromagnetic field depicted in sensor and source space

Affiliations

Modulation of magnetoencephalography alpha band activity by radiofrequency electromagnetic field depicted in sensor and source space

Jasmina Wallace et al. Sci Rep. .

Abstract

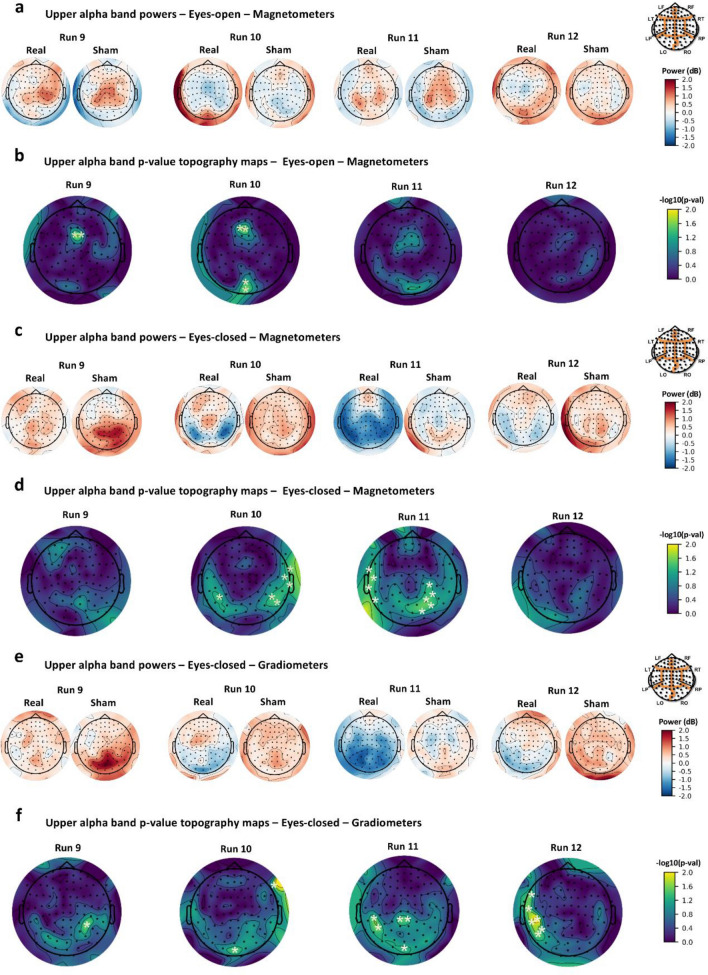
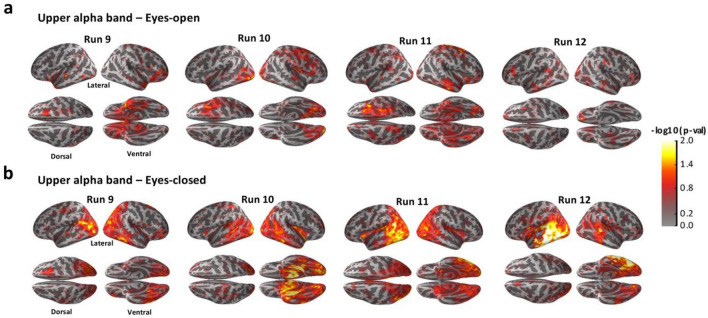
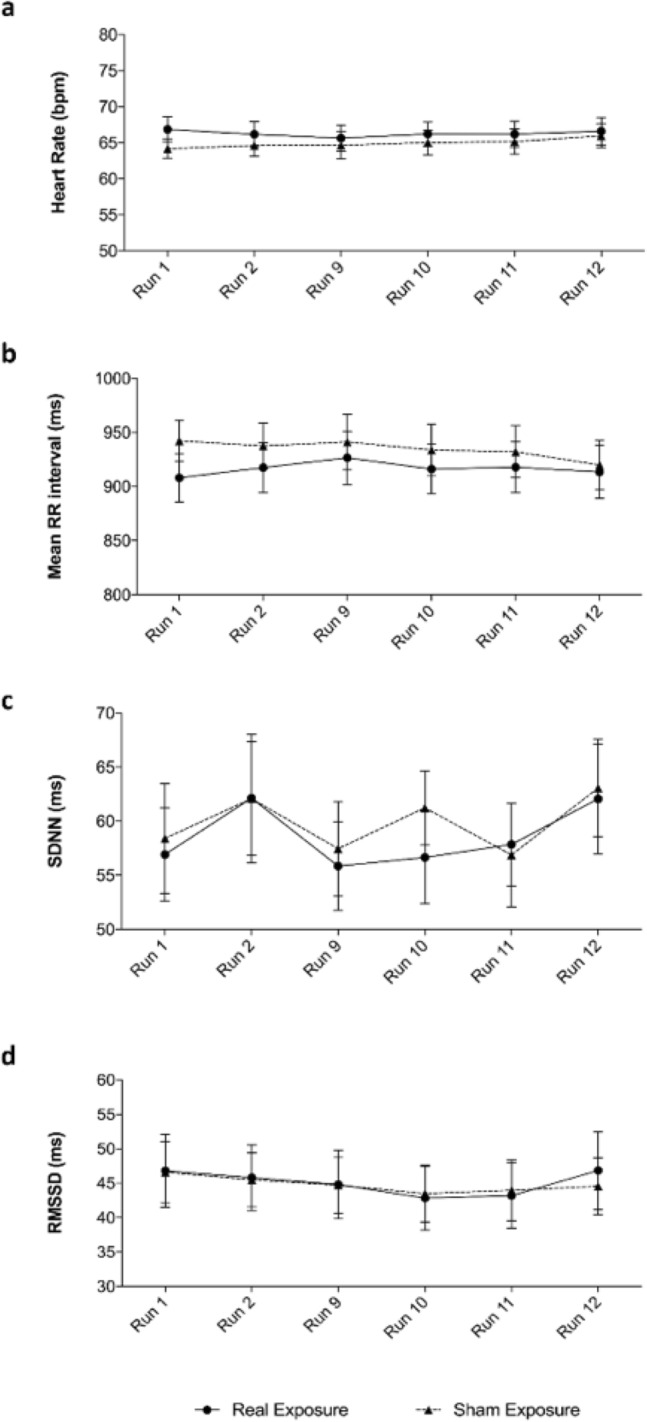
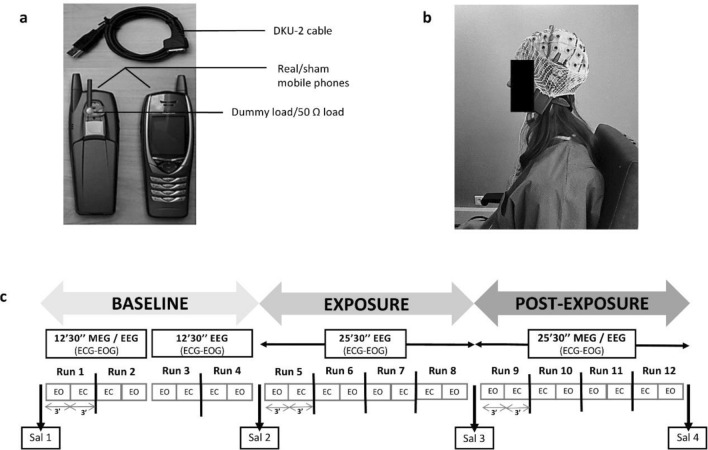
Several studies reported changes in spontaneous electroencephalogram alpha band activity related to radiofrequency electromagnetic fields, but findings showed both an increase and a decrease of its spectral power or no effect. Here, we studied the alpha band modulation after 900 MHz mobile phone radiofrequency exposure and localized cortical regions involved in these changes, via a magnetoencephalography (MEG) protocol with healthy volunteers in a double-blind, randomized, counterbalanced crossover design. MEG was recorded during eyes open and eyes closed resting-state before and after radiofrequency exposure. Potential confounding factors, known to affect alpha band activity, were assessed as control parameters to limit bias. Entire alpha band, lower and upper alpha sub-bands MEG power spectral densities were estimated in sensor and source space. Biochemistry assays for salivary biomarkers of stress (cortisol, chromogranin-A, alpha amylase), heart rate variability analysis and high-performance liquid chromatography for salivary caffeine concentration were realized. Results in sensor and source space showed a significant modulation of MEG alpha band activity after the radiofrequency exposure, with different involved cortical regions in relation to the eyes condition, probably because of different attention level with open or closed eyes. None of the control parameters reported a statistically significant difference between experimental sessions.


Conflict of interest statement

The authors declare no competing interests.

Figures

Figure 1
Figure 1
MEG sensor space results for the lower alpha band with magnetometers during eyes-open recordings (a, b) and gradiometers during eyes-open recordings (c, d). Power topography maps show baseline-corrected power values computed in sensor space for each sensor during runs of the real and the sham exposure session for 29 subjects and plotted according to the 102 MEG sensor triplets layout (LF, left frontal region; RF, right frontal region; LT, left temporal region; RT, right temporal region; LP, left parietal region; RP, right parietal region; LO, left occipital region; RO, right occipital region). p value topography maps show the results of one-way ANOVA on MEG baseline-corrected lower alpha band power of RF-EMF post-exposure sessions (real vs. sham) at sensor level analysis. p values were computed for each sensor for each run (*p < 0.05).
Figure 2
Figure 2
MEG sensor space results for the upper alpha band with magnetometers during eyes-open recordings (a, b), with magnetometers during eyes-closed recordings (c, d) and with gradiometers during eyes-closed recordings (e, f). Power topography maps show baseline-corrected power values computed in sensor space for each sensor during runs of the real and the sham exposure session for 29 subjects and plotted according to the 102 MEG sensor triplets layout (LF, left frontal region; RF, right frontal region; LT, left temporal region; RT, right temporal region; LP, left parietal region; RP, right parietal region; LO, left occipital region; RO, right occipital region). p value topography maps show the results of one-way ANOVA on MEG baseline-corrected upper alpha band power of RF-EMF post-exposure sessions (real vs. sham) at sensor level analysis. p values were computed for each sensor for each run (*p < 0.05).
Figure 3
Figure 3
p value maps of one-way ANOVA on MEG baseline-corrected lower alpha band power spectral density of RF-EMF post-exposure sessions (real vs. sham) at source level analysis during eyes-open recordings (a) and eyes-closed recordings (b). p values were computed for each MEG source location (4098 current dipoles per hemisphere) for 29 subjects (p  < 0.05). The cortex is shown inflated with gyri darker than sulci, with lateral (left and right), dorsal and ventral visualizations.
Figure 4
Figure 4
p value maps of one-way ANOVA on MEG baseline-corrected upper alpha band power spectral density of RF-EMF post-exposure sessions (real vs. sham) at source level analysis during eyes-open recordings (a) and eyes-closed recordings (b). p values were computed for each MEG source location (4098 current dipoles per hemisphere) for 29 subjects (p < 0.05). The cortex is shown inflated with gyri darker than sulci, with lateral (left and right), dorsal and ventral visualizations.
Figure 5
Figure 5
Results of ECG analysis. Heart rate data are show as means ± SEM (a). Heart rate variability data are show as means ± SEM and were estimated in time-domain: mean RR interval (b), standard deviation of the RR intervals, SDNN (c), square root of the mean squared differences between successive RR intervals, RMSSD (d).
Figure 6
Figure 6
Results of biochemistry assays for salivary biomarkers of stress: cortisol (a), chromogranin A (b) and alpha amylase (c). Saliva samples (Sal) were analyzed considering samples collected during morning and afternoon experimental sessions, separately (13 and 16 subjects, respectively). Data are shown as means ± SEM. Statistical significance was set for p < 0.05 (**p < 0.01; *p < 0.05, one-way ANOVA followed by Bonferroni Multiple Comparison Test).
Figure 7
Figure 7
Exposure system (a), exposure setup (b) and experimental protocol (c). Both mobile phones looked the same, but their electromagnetic radiation field was different. One of them was placed against the left ear with a tubular tissue bandage during the exposure. Each recording session included three phases: the baseline phase, with 12 min and 30 s of magnetoencephalography (MEG) and electroencephalography (EEG) simultaneously recorded and 12 min and 30 s of EEG recording; the exposure phase with 25 min and 30 s of EEG recording; the post-exposure phase with 25 min and 30 s of MEG and EEG combined recordings. Recording runs were performed with 3 min of eyes-open (EO) and eyes-closed (EC) sequences in alternation. After each run there was 30 s pause. Electrocardiogram (ECG) and electro-oculogram (EOG) were simultaneously recorded. Four saliva samples were collected (Sal 1, Sal 2, Sal 3, Sal 4).

References

    1. Huber R, et al. Exposure to pulse-modulated radio frequency electromagnetic fields affects regional cerebral blood flow. Eur. J. Neurosci. 2005;21:1000–1006. doi: 10.1111/j.1460-9568.2005.03929.x. - DOI - PubMed
    1. Aalto S, et al. Mobile phone affects cerebral blood flow in humans. J. Cereb. Blood Flow Metab. 2006;26:885–890. doi: 10.1038/sj.jcbfm.9600279. - DOI - PubMed
    1. Ghosn R, et al. Effects of GSM 900 MHz on middle cerebral artery blood flow assessed by transcranial Doppler sonography. Radiat. Res. 2012;178:543–550. doi: 10.1667/RR3007.1. - DOI - PubMed
    1. Curcio G, et al. Effects of mobile phone signals over BOLD response while performing a cognitive task. Clin. Neurophysiol. 2012;123:129–136. doi: 10.1016/j.clinph.2011.06.007. - DOI - PubMed
    1. Wei Y, Yang J, Chen Z, Wu T, Lv B. Modulation of resting-state brain functional connectivity by exposure to acute fourth-generation long-term evolution electromagnetic field: An fMRI study. Bioelectromagnetics. 2019;40:42–51. doi: 10.1002/bem.22165. - DOI - PubMed

Publication types