

Ultra-processed food consumption in adults across Europe
- PMID: 34862518
- PMCID: PMC8921104
- DOI: 10.1007/s00394-021-02733-7
Ultra-processed food consumption in adults across Europe
Abstract
Purpose: The purpose of this study is to describe ultra-processed food and drinks (UPFDs) consumption, and associations with intake of total sugar and dietary fibre, and high BMI in adults across Europe.
Methods: Using food consumption data collected by food records or 24-h dietary recalls available from the European Food Safety Authority (EFSA) Comprehensive European Food Consumption Database, the foods consumed were classified by the level of processing using the NOVA classification. Diet quality was assessed by data linkage to the Dutch food composition tables (NEVO) and years lived with disability for high BMI from the Global Burden of Disease Study 2019. Bivariate groupings were carried out to explore associations of UPFDs consumption with population intake of sugar and dietary fibre, and BMI burden, visualised by scatterplots.
Results: The energy share from UPFDs varied markedly across the 22 European countries included, ranging from 14 to 44%, being the lowest in Italy and Romania, while the highest in the UK and Sweden. An overall modest decrease (2-15%) in UPFDs consumption is observed over time, except for Finland, Spain and the UK reporting increases (3-9%). Fine bakery wares and soft drinks were most frequently ranked as the main contributor. Countries with a higher sugar intake reported also a higher energy share from UPFDs, as most clearly observed for UPF (r = 0.57, p value = 0.032 for men; and r = 0.53, p value = 0.061 for women). No associations with fibre intake or high BMI were observed.
Conclusion: Population-level UPFDs consumption substantially varied across Europe, although main contributors are similar. UPFDs consumption was not observed to be associated with country-level burden of high BMI, despite being related to a higher total sugar intake.
Keywords: Diet quality; Europe; Food consumption survey; NOVA classification; Ultra-processed foods.
© 2021. The Author(s).
Conflict of interest statement
The authors declare that the research was conducted in the absence of any commercial or financial relationships that could be construed as a potential conflict of interest.
Figures

 24-h recalls;
  Food records. AT Austria, BE Belgium, DK Denmark, EN% energy percentages, ES Spain, FI Finland, FR France, LV Latvia, IE Ireland, NL the Netherlands, SE Sweden, UK United Kingdom, UPFD ultra-processed foods and drinks
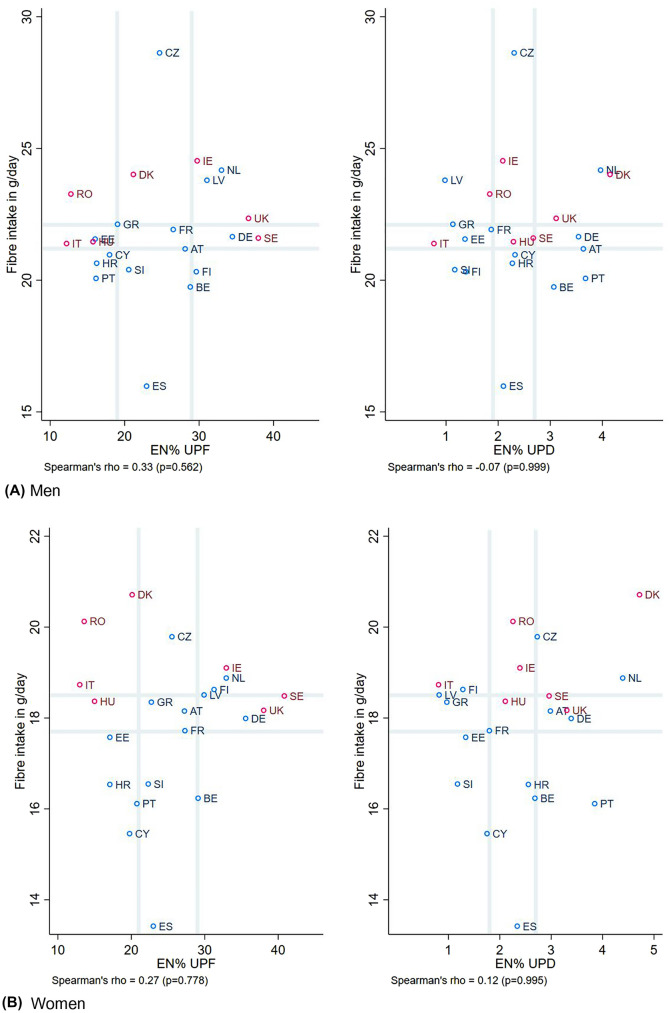
 24-hR;
  Food records. Grey vertical and horizontal gridlines indicate tertiles dividing lines for the measures: the share of dietary energy from UPFs (at 19.0 and 28.8 EN% for men, and at 20.7 and 29.1 EN% for women) and UPDs (at 1.9 and 2.7 EN% for men, and at 1.8 and 2.7 EN% for women), and fibre intake (at 21.2 and 22.1 g/day for men, and at 17.7 and 18.5 g/day for women). AT Austria, BE Belgium, CY Cyprus, CZ Czech Republic, DE Germany, DK Denmark, EE Estonia, EN% energy percentage, ES Spain, FI Finland, FR France, GR Greece, HR Croatia, HU Hungary, IE Ireland, IT Italy, LV Latvia, NL the Netherlands, PT Portugal, RO Romania, SE Sweden, SI Slovenia, UK United Kingdom, UPD ultra-processed drinks, UPF ultra-processed foods
 24-hR;
  Food records. Grey vertical and horizontal gridlines indicate tertiles dividing lines for the measures: the share of dietary energy from UPFs (at 19.0 and 28.8 EN% for men, and at 20.7 and 29.1 EN% for women) and UPDs (at 1.9 and 2.7 EN% for men, and at 1.8 and 2.7 EN% for women), and sugar intake (at 95.4 and 115.0 g/day for men, and at 82.4 and 98.8 g/day for women). AT Austria, BE Belgium, CY Cyprus, CZ Czech Republic, DE Germany, DK Denmark, EE Estonia, EN% energy percentage, ES Spain, FI Finland, FR France, GR Greece, HR Croatia, HU Hungary, IE Ireland, IT Italy, LV Latvia, NL the Netherlands, PT Portugal, RO Romania, SE Sweden, SI Slovenia, UK United Kingdom, UPD ultra-processed drinks, UPF ultra-processed foods
 24-hR;
  Food records. Grey vertical and horizontal gridlines indicate tertiles dividing lines for the measures: the share of dietary energy from UPFs (at 19.0 and 28.8 EN% for men, and at 20.7 and 29.1 EN% for women) and UPDs (at 1.9 and 2.7 EN% for men, and at 1.8 and 2.7 EN% for women), and YLD for high BMI per 100,000 (at 443 and 573 for men, and at 495 and 675 for women). AT Austria, BE Belgium, CY Cyprus, CZ Czech Republic, DE Germany, DK Denmark, EE Estonia, EN% energy percentage, ES Spain, FI Finland, FR France, GR Greece, HR Croatia, HU Hungary, IE Ireland, IT Italy, LV Latvia, NL the Netherlands, PT Portugal, RO Romania, SE Sweden, SI Slovenia, UK United Kingdom, UPD ultra-processed drinks, UPF ultra-processed foods, YLD Years Lived with Disability, in age-standardised rates per 100,000
References
-
- Monteiro CA, Cannon G, Lawrence M, Costa Louzada ML, Pereira Machado P. Ultra-processed foods, diet quality and health using the NOVA classification system. Rome: FAO; 2019.
MeSH terms
Grants and funding
LinkOut - more resources
Full Text Sources
