

What makes a good prediction? Feature importance and beginning to open the black box of machine learning in genetics
- PMID: 34862561
- PMCID: PMC9360120
- DOI: 10.1007/s00439-021-02402-z
What makes a good prediction? Feature importance and beginning to open the black box of machine learning in genetics
Abstract
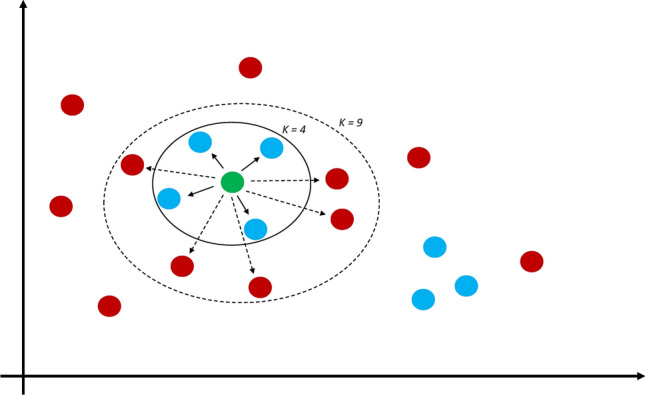
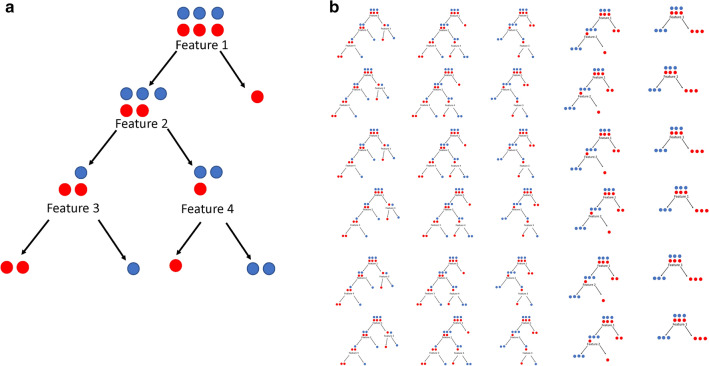
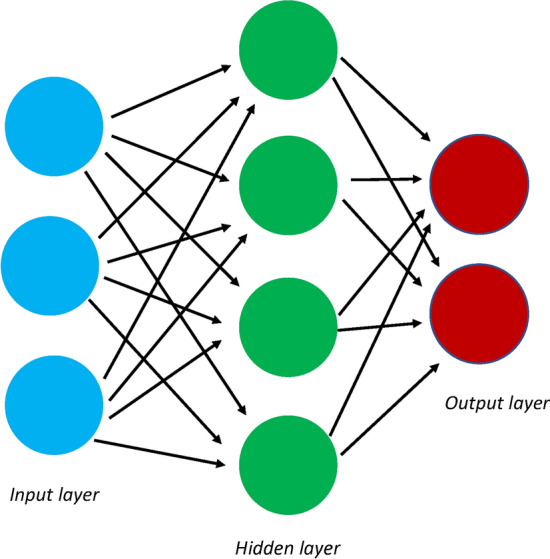
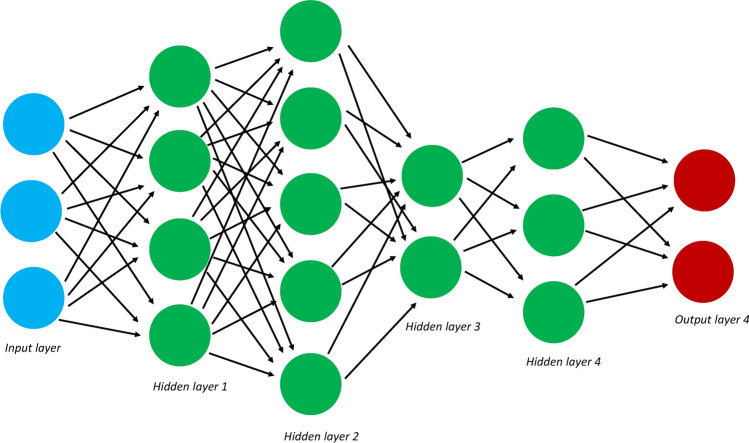
Genetic data have become increasingly complex within the past decade, leading researchers to pursue increasingly complex questions, such as those involving epistatic interactions and protein prediction. Traditional methods are ill-suited to answer these questions, but machine learning (ML) techniques offer an alternative solution. ML algorithms are commonly used in genetics to predict or classify subjects, but some methods evaluate which features (variables) are responsible for creating a good prediction; this is called feature importance. This is critical in genetics, as researchers are often interested in which features (e.g., SNP genotype or environmental exposure) are responsible for a good prediction. This allows for the deeper analysis beyond simple prediction, including the determination of risk factors associated with a given phenotype. Feature importance further permits the researcher to peer inside the black box of many ML algorithms to see how they work and which features are critical in informing a good prediction. This review focuses on ML methods that provide feature importance metrics for the analysis of genetic data. Five major categories of ML algorithms: k nearest neighbors, artificial neural networks, deep learning, support vector machines, and random forests are described. The review ends with a discussion of how to choose the best machine for a data set. This review will be particularly useful for genetic researchers looking to use ML methods to answer questions beyond basic prediction and classification.
© 2021. This is a U.S. government work and not under copyright protection in the U.S.; foreign copyright protection may apply.
Conflict of interest statement
On behalf of all authors, the corresponding author states that there is no conflict of interest.
Figures
Similar articles
-
A Review of Machine Learning Algorithms for Biomedical Applications.Ann Biomed Eng. 2024 May;52(5):1159-1183. doi: 10.1007/s10439-024-03459-3. Epub 2024 Feb 21. Ann Biomed Eng. 2024. PMID: 38383870 Review.
-
Artificial intelligence algorithm comparison and ranking for weight prediction in sheep.Sci Rep. 2023 Aug 15;13(1):13242. doi: 10.1038/s41598-023-40528-4. Sci Rep. 2023. PMID: 37582936 Free PMC article.
-
A deep neural network-based approach for prediction of mutagenicity of compounds.Environ Sci Pollut Res Int. 2021 Sep;28(34):47641-47650. doi: 10.1007/s11356-021-14028-9. Epub 2021 Apr 24. Environ Sci Pollut Res Int. 2021. PMID: 33895950
-
A comparative evaluation of the generalised predictive ability of eight machine learning algorithms across ten clinical metabolomics data sets for binary classification.Metabolomics. 2019 Nov 15;15(12):150. doi: 10.1007/s11306-019-1612-4. Metabolomics. 2019. PMID: 31728648 Free PMC article.
-
Machine learning approach to gene essentiality prediction: a review.Brief Bioinform. 2021 Sep 2;22(5):bbab128. doi: 10.1093/bib/bbab128. Brief Bioinform. 2021. PMID: 33842944 Review.
Cited by
-
Enhancing the classification of seismic events with supervised machine learning and feature importance.Sci Rep. 2024 Dec 24;14(1):30638. doi: 10.1038/s41598-024-81113-7. Sci Rep. 2024. PMID: 39719528 Free PMC article.
-
Editorial: Medical knowledge-assisted machine learning technologies in individualized medicine.Front Mol Biosci. 2023 Mar 24;10:1167730. doi: 10.3389/fmolb.2023.1167730. eCollection 2023. Front Mol Biosci. 2023. PMID: 37033449 Free PMC article. No abstract available.
-
Overcoming Limitations to Deep Learning in Domesticated Animals with TrioTrain.bioRxiv [Preprint]. 2024 Apr 20:2024.04.15.589602. doi: 10.1101/2024.04.15.589602. bioRxiv. 2024. Update in: Genome Res. 2025 Aug 1;35(8):1859-1874. doi: 10.1101/gr.279542.124. PMID: 38659907 Free PMC article. Updated. Preprint.
-
Machine learning discrimination of Gleason scores below GG3 and above GG4 for HSPC patients diagnosis.Sci Rep. 2024 Oct 27;14(1):25641. doi: 10.1038/s41598-024-77033-1. Sci Rep. 2024. PMID: 39465343 Free PMC article.
-
Deciphering colorectal cancer radioresistance and immune microrenvironment: unraveling the role of EIF5A through single-cell RNA sequencing and machine learning.Front Immunol. 2024 Sep 3;15:1466226. doi: 10.3389/fimmu.2024.1466226. eCollection 2024. Front Immunol. 2024. PMID: 39290702 Free PMC article.
References
-
- Arloth J, Eraslan G, Andlauer TFM, Martins J, Iurato S, Kühnel B, Waldenberger M, Frank J, Gold R, Hemmer B, Luessi F, Nischwitz S, Paul F, Wiendl H, Gieger C, Heilmann-Heimbach S, Kacprowski T, Laudes M, Meitinger T, Peters A, Rawal R, Strauch K, Lucae S, Müller-Myhsok B, Rietschel M, Theis FJ, Binder EB, Mueller NS. DeepWAS: Multivariate genotype-phenotype associations by directly integrating regulatory information using deep learning. PLoS Comput Biol. 2020;16:e1007616. doi: 10.1371/journal.pcbi.1007616. - DOI - PMC - PubMed
Publication types
MeSH terms
Grants and funding
LinkOut - more resources
Full Text Sources
Miscellaneous
