Review
. 2021 Dec 4;12(1):179.
doi: 10.1186/s13244-021-01125-z.

Magnetism of materials: theory and practice in magnetic resonance imaging

Affiliations
Review

Magnetism of materials: theory and practice in magnetic resonance imaging

Michele Gaeta et al. Insights Imaging. .

Abstract

All substances exert magnetic properties in some extent when placed in an external magnetic field. Magnetic susceptibility represents a measure of the magnitude of magnetization of a certain substance when the external magnetic field is applied. Depending on the tendency to be repelled or attracted by the magnetic field and in the latter case on the magnitude of this effect, materials can be classified as diamagnetic or paramagnetic, superparamagnetic and ferromagnetic, respectively. Knowledge of type and extent of susceptibility of common endogenous and exogenous substances and how their magnetic properties affect the conventional sequences used in magnetic resonance imaging (MRI) can help recognize them and exalt or minimize their presence in the acquired images, so as to improve diagnosis in a wide variety of benign and malignant diseases. Furthermore, in the context of diamagnetic susceptibility, chemical shift imaging enables to assess the intra-voxel ratio between water and fat content, analyzing the tissue composition of various organs and allowing a precise fat quantification. The following article reviews the fundamental physical principles of magnetic susceptibility and examines the magnetic properties of the principal endogenous and exogenous substances of interest in MRI, providing potential through representative cases for improved diagnosis in daily clinical routine.

Keywords: Artifact reduction; Chemical shift; Magnetic resonance imaging (MRI); Magnetic susceptibility.


Conflict of interest statement

The authors declare that they have no competing interest.

Figures

Fig. 1
Fig. 1
The magnitude image a is the sum of different intravoxel sources of MRI contrast (b), here schematically represented in an onion model. DP = Proton density; T1 = longitudinal relaxation time; T2 = transverse relaxation time; CSh = chemical shift; SM = magnetic susceptibility; MT = magnetization transfer; CEST = chemical exchange saturation transfer; D = diffusion, isotropic (is) and anisotropic (ais); P = Perfusion
Fig. 2
Fig. 2
Opposed-phase (a) and in-phase (b) gradient echo (GE) T1-w. images of the upper abdomen show severe hepatic steatosis. A proton density fat fraction (PDFF) sequence (c) demonstrates a fat fraction of 44% in liver segment VIII. Hydrogen-spectroscopy (d) confirms the fat fraction quantification
Fig. 3
Fig. 3
Sagittal short inversion time inversion recovery (STIR) (a) and T1-w. turbo spin echo (TSE) (b) series showing multiple, ill-defined, lumbar vertebral body metastatic lesions in a 57-year-old patient with known lung cancer. Sagittal in-phase (c) and opposed-phase (d) gradient echo (GE) T1-w. series in the same patient. Opposed-phase image shows with great advantage and better details the various lesions, as areas of red bone marrow substitution. Arrows indicate the most prominent lesions
Fig. 4
Fig. 4
27-year-old male patient complaining of swelling and worsening pain in the left thigh for a week. Axial turbo spin echo (TSE) nonenhanced T1-w. image a shows a cystic round lesion (arrow) within the vastus medialis muscle of the left thigh. TSE T2-w. scan (b) at the same level well depicts the edema of the muscle around the lesion. A clear, subtle rim (hyperintense in a and strongly hypointense in b) encircling the cystic component can be noted, representing the lesion wall. The mass shows typical central restricted diffusion on the apparent diffusion coefficient map (c) and on the diffusion-weighted imaging (d) sequence. The findings were consistent with muscular abscess (arrows)
Fig. 5
Fig. 5
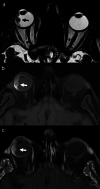
Axial balanced fast field echo (bFFE) MR image (a) showing an irregular and hypointense tissue plaque along the lateral wall of the right eye. Nonenhanced turbo spin echo (TSE) after spectral presaturation with inversion recovery (SPIR) T1-w. scan b demonstrates that the lesion is hyperintense. On contrast-enhanced TSE T1-w. image (obtained after subtraction of signal of nonenhanced image) (c) enhancement of the lesion can be seen, demonstrating that the lesion is vascularized. The findings are consistent with melanoma (arrows)
Fig. 6
Fig. 6
Axial opposed-phase (a) and in-phase (b) GE images showing a linear susceptibility-related artifact in the left hepatic duct, consistent with pneumobilia. The hypointensity is more conspicuous on the in-phase image
Fig. 7
Fig. 7
Axial turbo spin echo (TSE) T2-w. image a of the abdomen does not show any focal lesion on the caudate lobe of the liver (arrow). On nonenhanced opposed-phase gradient echo (GE) T1-w. image b a well-defined hyperintense nodule (arrow) at the same level can be identified. Contrast-enhanced fat-saturated GE T1-w. scan in the arterial phase (obtained after subtraction of signal of nonenhanced image) (c) shows distinct contrast-enhancement of the lesion (arrow). Final diagnosis was low-grade hepatocellular carcinoma
Fig. 8
Fig. 8
Abdominal X-ray (a) showing two metallic devices in the right (arrowhead) and left (arrow) upper quadrants, respectively. The devices cause magnetic susceptibility-related artifacts on in-phase (b) and opposed-phase (b′) gradient echo (GE) T1-w. images in the stomach (arrow) and hepatic hilum (arrowhead), respectively; the signal intensity loss is higher on in-phase image (b). It is worthy of note that the magnetic device in the stomach (a ferromagnetic steel clip) causes a much more prominent artifact than the device in hepatic hilum (a paramagnetic titanium clip by previous cholecystectomy)
Fig. 9
Fig. 9
Images of the right ankle (a and b) in a 35-year-old man with hemophilia. Presence of intra-articular hemosiderin (arrows) is seen with greater advantage on GE T2*-w. image (b) compared to TSE T2-w. scan (a)
Fig. 10
Fig. 10
A 58-year-old woman with symptoms of chronic compartment syndrome of the right lower leg. Coronal turbo spin echo (TSE) T2-w. fat-saturated image a shows an ovoidal mass (arrow) between the muscles of the posterior compartment. Contrast-enhanced study (not shown) was inconclusive. On gradient echo (GE) T2*-w. images obtained simultaneously with different echoes—8, 16 and 40 ms (b–d), respectively—evident and homogeneous blooming of the entire lesion allows to characterize the mass as a hematoma (arrow)
Fig. 11
Fig. 11
Axial opposed-phase (a) and in-phase (b) gradient echo (GE) T1-w. and short inversion time inversion recovery (STIR) c series of the left leg in a 35-year-old patient with a distinct susceptibility artifact due to a superficial iron surgical clip (arrow). A marked enlargement of the metallic artifact is noted in the in-phase image [echo time (TE): 4.6 ms] compared to the opposed-phase image (TE: 2.3 ms). On STIR sequence (TE: 40 ms) the artifact is less evident despite the use of a longer TE, due to the use of multiple re-phasing 180° pulses (turbo spin echo factor: 20)
Fig. 12
Fig. 12
Magnetic susceptibility-related signal intensity loss on in-phase gradient echo (GE) T1-w. image a with respect to opposed-phase image (b). The signal intensity loss is around 30% and is due to presence of hemosiderin in a patient with hepatic hemosiderosis. On turbo spin echo (TSE) T2-w. image (c) a marked hypointensity of the liver confirms the diagnosis of intra-hepatic hemosiderin deposition
Fig. 13
Fig. 13
32-year-old woman with chronic pelvic pain. Axial T1-w. fat-saturated scan (a) of the pelvis shows two large hyperintense endometrial cysts. Axial T2-w. scan (b) through the same level demonstrates a slight “shading” phenomenon in the cysts. In the short inversion time inversion recovery (STIR) image (c) the signal of the cysts is cancelled because they have the same T1 of the fat
Fig. 14
Fig. 14
38-year-old patient with cervical carcinoma. On contrast-enhanced turbo spin echo (TSE) T1-w. fat-saturated sagittal image (a) differentiation between normal uterus and cancer is difficult. On sagittal short inversion time inversion recovery (STIR) scan (b) obtained at the same level immediately after TSE sequence, the signal of normal uterus is cancelled and hyperintense cancer is well depicted. There is an optimal correspondence between STIR and diffusion-weighted image (c), where spatial resolution is however lower. Contrast-enhanced gradient echo (GE) T1-w. fat-saturated scan (d) through the right kidney. Contrast-enhanced fast-STIR image (e) obtained immediately after d shows that the signal of renal parenchyma is cancelled since its T1 is equal to that of fat
Fig. 15
Fig. 15
25-year-old female patient with suspected meningitis. Nonenhanced fluid attenuated inversion recovery (FLAIR) a image appears negative. Turbo spin echo (TSE) T1-w. magnetization transfer scan b is inconclusive, although mild effacement of some frontal and parietal sulci can be suspected (arrows). On contrast-enhanced FLAIR (c) scan extensive hyperintensity of several sulci can be easily diagnosed (arrows)
Fig. 16
Fig. 16
45-year-old woman with an episode of seizure. On axial turbo spin echo (TSE) T2-w. image a two almost imperceptible areas of linear hypointensity can be noted (arrow shows the most prominent in the parietal lobe). Axial susceptibility weighted imaging (SWI) scan at the same level (b) shows evident susceptibility artifacts caused by hemosiderin within small vascular malformations. The same artifacts can also be noted in echo-planar imaging (EPI) diffusion-weighted image with a b-value of zero (c). EPI sequence sensitivity to susceptibility artifact is well depicted by comparison between TSE T2-w. e and EPI image (f) of the brain in a patient with a ferromagnetic dental device

References

    1. Damadian R. Tumor detection by nuclear magnetic resonance. Science. 1971;171(3976):1151–1153. doi: 10.1126/science.171.3976.1151. - DOI - PubMed
    1. Mansfield P, Maudsley AA. Medical imaging by NMR. Br J Radiol. 1977;50(591):188–194. doi: 10.1259/0007-1285-50-591-188. - DOI - PubMed
    1. Halle B. Water in biological systems: the NMR picture. In: Bellissent-Funel MC, editor. Hydration processes in biology: theoretical and experimental approaches. Clifton: IOS Press; 1999. pp. 233–249.
    1. Bydder GM. The Agfa Mayneord lecture: MRI of short and ultrashort T2 and T2* components of tissues, fluids and materials using clinical systems. Br J Radiol. 2011;84(1008):1067–1082. doi: 10.1259/bjr/74368403. - DOI - PMC - PubMed
    1. Chen SZ, Yuan J, Deng M, Wei J, Zhou J, Wáng YX. Chemical exchange saturation transfer (CEST) MR technique for in-vivo liver imaging at 3.0 tesla. Eur Radiol. 2016;26(6):1792–1800. doi: 10.1007/s00330-015-3972-0. - DOI - PMC - PubMed

LinkOut - more resources