. 2021 Dec 4;12(1):598.
doi: 10.1186/s13287-021-02664-4.

Role of PD-L1 in licensing immunoregulatory function of dental pulp mesenchymal stem cells

Affiliations

Role of PD-L1 in licensing immunoregulatory function of dental pulp mesenchymal stem cells

Rosanna Di Tinco et al. Stem Cell Res Ther. .

Abstract

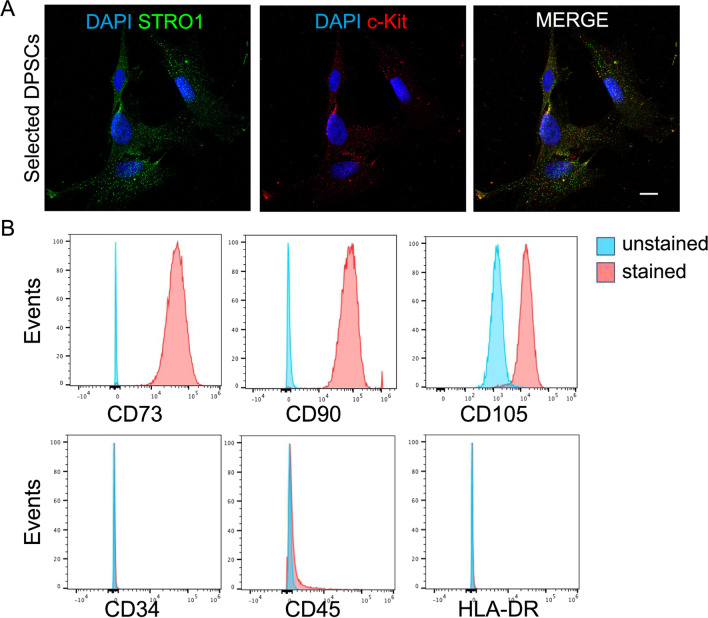
Background: Dental pulp stem cells (DPSCs) are low immunogenic and hold immunomodulatory properties that, along with their well-established multi-potency, might enhance their potential application in autoimmune and inflammatory diseases. The present study focused on the ability of DPSCs to modulate the inflammatory microenvironment through PD1/PD-L1 pathway.

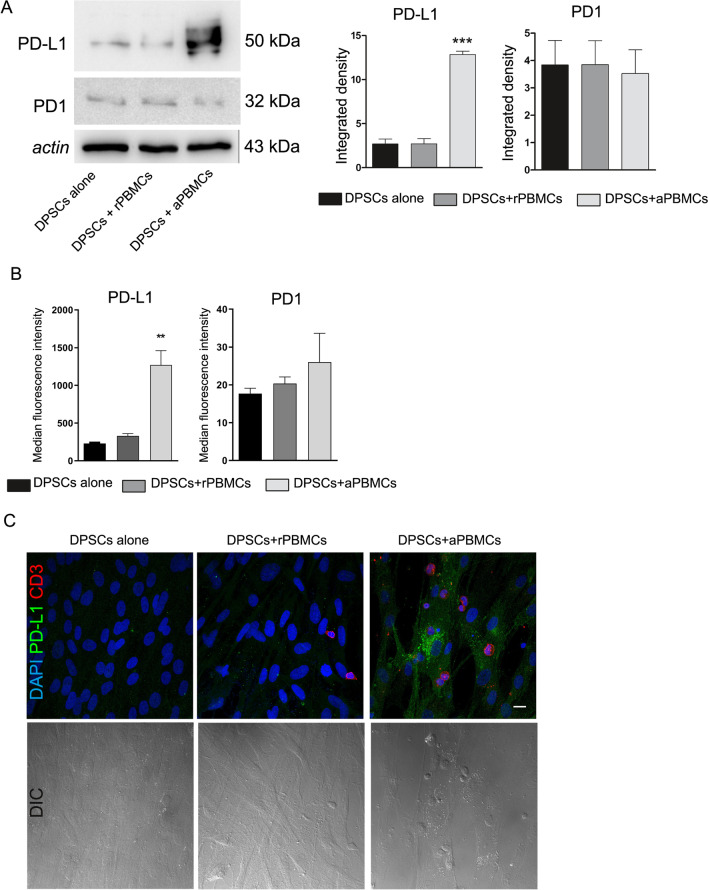
Methods: Inflammatory microenvironment was created in vitro by the activation of T cells isolated from healthy donors and rheumatoid arthritis (RA) patients with anti-CD3 and anti-CD28 antibodies. Direct and indirect co-cultures between DPSCs and PBMCs were carried out to evaluate the activation of immunomodulatory checkpoints in DPSCs and the inflammatory pattern in PBMCs.

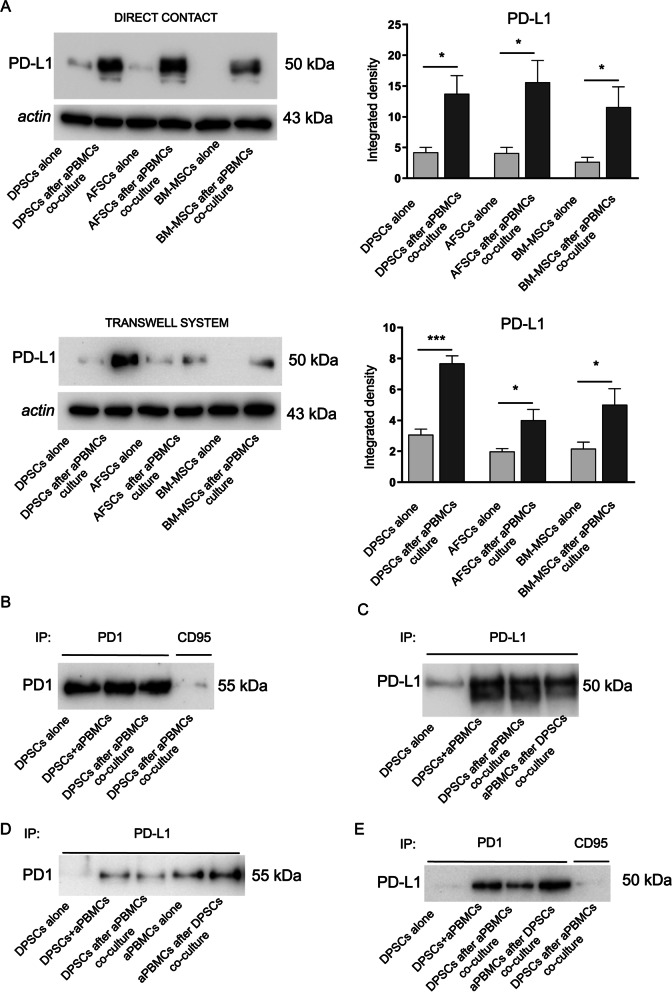
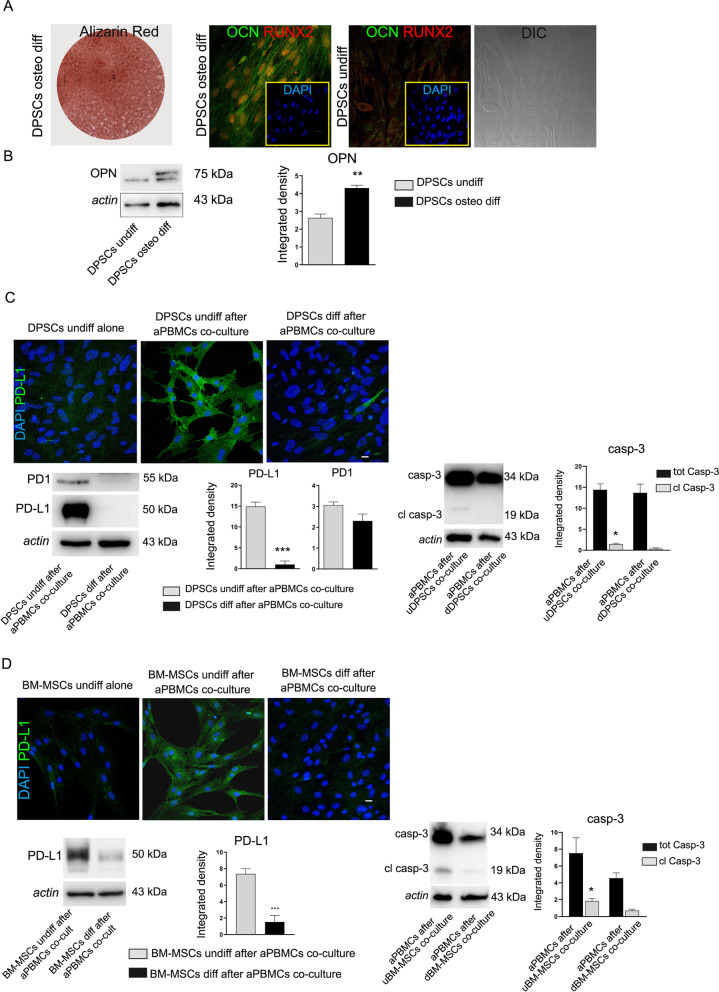
Results: Our data suggest that the inflammatory stimuli trigger DPSCs immunoregulatory functions that can be exerted by both direct and indirect contact. As demonstrated by using a selective PD-L1 inhibitor, DPSCs were able to activate compensatory pathways targeting to orchestrate the inflammatory process by modulating pro-inflammatory cytokines in pre-activated T lymphocytes. The involvement of PD-L1 mechanism was also observed in autologous inflammatory status (pulpitis) and after direct exposure to pre-activated T cells from RA patients suggesting that immunomodulatory/anti-inflammatory properties are strictly related to their stemness status.

Conclusions: Our findings point out that the communication with the inflammatory microenvironment is essential in licensing their immunomodulatory properties.

Keywords: DPSCs; Immunomodulatory functions; Neural crest stem cells; PD1/PD-L1 pathway.


Conflict of interest statement

The authors declare no competing interests exist.

Figures

Fig. 1
Fig. 1
Dental pulp stem cells (DPSCs) characterization. A Immunofluorescence analysis on immune-selected DPSCs for stem cells markers STRO-1 (green) and c-Kit (red). Almost all selected cells are positively labeled against both stemness markers. Nuclei were counterstained with DAPI. Scale bar: 10 µm. B Immunophenotypical characterization and MSC markers expression in immune-selected DPSCs. DPSCs are 99% positive for CD73, CD90 and CD105 while being negative for CD34, CD45 and HLA-DR
Fig. 2
Fig. 2
Immunomodulatory properties of DPSCs. A Western blot analyses performed on DPSCs alone and after direct co-culture with rPBMCs and aPBMCs for PD-L1 and PD1. Histograms show that DPSCs after co-culture with aPBMCs are able to express statistically significant higher levels of PD-L1. ***P < 0.001 versus DPSCs alone and versus DPSCs + rPBMCs. Data are expressed as mean ± SD and analyzed by one-way ANOVA followed by Newman-Keuls post-hoc test. B Expression of PD1 and PD-L1 was evaluated by flow cytometry on DPSCs cultured alone, co-cultured with rPBMCs and with aPBMCs. Median fluorescence intensity obtained by PD1 and PD-L1 staining minus median fluorescence intensity in FITC and PECy7 channels of FMO controls is shown. Data are represented as mean ± SD and analyzed by one-way ANOVA with Tukey post-hoc test. C Immunofluorescence analysis performed on DPSCs alone and in direct co-culture with rPBMCs and aPBMCs. DPSCs in co-culture with aPBMCs (red CD3+) are able to express PD-L1. DIC images on the bottom highlight the cell morphology and the co-culture system setup. Nuclei were counterstained with DAPI. Scale bar: 10 µm
Fig. 3
Fig. 3
Activation of PD1/PD-L1 pathway in MSCs. A Western blot analyses of PD-L1 expression in DPSCs, AFSCs and BM-MSCs cultured alone and after co-culture with aPBMCs, either in direct co-culture conditions and transwell culture system. Histograms show that PD-L1 expression was statistically significant higher in MSCs after both direct co-culture and transwell culture conditions with aPBMCs. ***P < 0.001, *P < 0.05 versus MSCs cultured alone. Data are represented as mean ± SD and statistical analysis of differences between MSCs cultured alone and MSCs after co-culture was carried out by unpaired Student t test. B–E Human PD1 and PD-L1 proteins immunoprecipitation. B PD1 protein was immunoprecipitated and revealed with anti-PD1 antibody. C PD-L1 protein was immunoprecipitated and revealed with anti-PD-L1 antibody. D PD-L1 protein was immunoprecipitated with anti-PD-L1 antibody and revealed with anti-PD1 antibody. E PD1 protein was immunoprecipitated with anti-PD1 antibody and revealed with anti-PD-L1 antibody. CD95 antibody was used as negative control
Fig. 4
Fig. 4
Evaluation of PD1/PD-L1 pathway and inflammatory cytokines expression in aPBMCs after DPSCs co-culture. A Expression of PD1 and PD-L1 was evaluated by flow cytometry on aPBMCs cultured alone and co-cultured with DPSCs with or without anti-PD-L1 blocking antibody. Median fluorescence intensity obtained by PD1 and PD-L1 staining minus median fluorescence intensity in FITC and PECy7 channels of FMO controls is shown in CD4+ and CD4 gated T lymphocytes. Data are expressed as mean ± SD and analyzed by one-way ANOVA followed by Tukey post-hoc test. *P < 0.05 aPBMCs + PD-L1 inib, aPBMCs after DPSCs co-culture + PD-L1 inib vs. aPBMCs; §P < 0.05, §§P < 0.01 aPBMCs after DPSCs co-culture + PD-L1 inib vs. aPBMCs after DPSCs co-culture. B The expression of IFNγ, TNFα, IL-2, IL-6, IL-10, CCL5 and CXCL10 was evaluated through Real Time PCR analyses on rPBMCs and aPBMCs alone, aPBMCs after DPSCs co-culture with and without PD-L1 selective inhibitor. Data are expressed as mean ± SD and analyzed by one-way ANOVA followed by Newman-Keuls post-hoc test. *P < 0.05, **P < 0.01, ***P < 0.001 vs. rPBMCs; §§P < 0.01, §§§P < 0.001 vs. aPBMCs; °°°P < 0.001 vs. aPBMCs after DPSCs co-culture. C The expression of caspase 3 and PCNA on aPBMCs cultured alone and after DPSCs co-culture with and without PD-L1 inib was evaluated by Western blot analyses. SC consisted in cleaved-caspase 3 positive control. *P < 0.05, **P < 0.01 §P < 0.05 vs. aPBMCs alone
Fig. 5
Fig. 5
Modulation of PD1/PD-L1 pathway in differentiated DPSCs and BM-MSCs. A After 3 weeks of induction, osteogenic differentiation of DPSCs was demonstrated by deposition of mineralized extracellular matrix as revealed by Alizarin Red stain and confirmed by immunofluorescence analyses of OCN and RUNX2. Undifferentiated DPSCs were used as negative control. Nuclei were counterstained with DAPI (yellow square). DIC image of undifferentiated DPSCs was reported on the right. B Western blot analysis of OPN in undifferentiated DPSCs and in differentiated DPSCs. Histograms show a statistically significant increased expression of OPN in differentiated DPSCs. **P < 0.01 versus DPSCs undiff. C Immunofluorescence and Western blot analyses demonstrating the modulation of PD-L1 expression in DPSCs. Representative images showed undifferentiated DPSCs labeled strongly positive only after co-culture with aPBMCs, whereas, after reaching osteogenic commitment no PD-L1 expression was detected. Scale bar: 10 µm. Western blot analysis of PD1 and PD-L1 showed that PD-L1 expression is statistically significant decreased in differentiated DPSCs after co-culture with aPBMCs in comparison to undifferentiated DPSCs co-cultured with aPBMCs; ***P < 0.001 vs. DPSCs undiff after aPBMCs co-culture. On the right side Western blot analysis showing caspase 3 expression in aPBMCs after co-culture with undifferentiated DPSCs (uDPSCs) and differentiated DPSCs (dDPSCs); *P < 0.05 versus aPBMCs after dDPSCs co-culture. D Down-regulation of PD-L1 in osteogenic differentiated BM-MSCs after aPBMCs co-culture was revealed by Immunofluorescence and Western blot analyses. Histograms show that PD-L1 expression was statistically significant reduced in BM-MSCs; ***P < 0.001 vs. BM-MSCs undiff after aPBMCs co-culture. On the right side Western blot analysis showing caspase 3 expression in aPBMCs after co-culture with undifferentiated BM-MSCs (uBM-MSCs) and differentiated BM-MSCs (dBM-MSCs); *P < 0.05 versus aPBMCs after dBM-MSCs co-culture. For each statistical analysis, data were expressed as mean ± SD
Fig. 6
Fig. 6
Immunoregulatory function of DPSCs. A Western blot analysis of PD-L1 and PCNA. A statistically significant reduction of PD-L1 expression was shown in DPSCs after aPBMCs co-culture + PD-L1 inib, similarly to DPSCs alone; §§P < 0.01 vs. DPSCs after aPBMCs co-culture. B Evaluation of cell proliferation by Ki-67 immunofluorescence analysis. Histograms report the mean percentage of Ki-67+ DPSCs. Nuclei were counterstained with DAPI (red square). Scale bar: 10 µm. C Evaluation of FasL expression by Real Time PCR analyses revealed that after aPBMCs co-culture with and without PD-L1 inhibitor, DPSCs statistically significant up-regulated mRNA levels of FasL in a time-dependent manner; *P < 0.05, **P < 0.01 vs. DPSCs alone. At 72 h, a statistically significant up-regulation of FasL was detected in DPSCs after aPBMCs co-culture additioned with PD-L1 inhibitor versus DPSCs after aPBMCs co-culture; §P < 0.05. D FasL expression was also evaluated by Western blot analysis in different experimental groups. Histograms reveal a statistically significant increase of FasL in DPSCs after aPBMCs co-culture with and without PD-L1 inib; *P < 0.05, **P < 0.01 vs. DPSCs alone. Data are represented as mean ± SD and one-way ANOVA followed by Newman-Keuls post-hoc test was carried out. E FasL expression (red) is confirmed by immunofluorescence analysis on Nestin+ DPSCs. Nuclei were counterstained with DAPI. Scale bar: 10 µm
Fig. 7
Fig. 7
PD-L1 involvement in inflammatory microenvironment. A Immunohistochemical evaluation of PD-L1 in vivo revealing a strong labeling in pulpitis-affected dental pulp. Tonsil was used as a positive control. Scale bar: 50 µm. B PD-L1 expression was assayed by Western blot in DPSCs after co-culture with rPBMCs and aPBMCs isolated from rheumatoid arthritis patients (RA PBMCs). Histograms show a statistically significant higher expression of PD-L1 only in DPSCs after RA aPBMCs co-culture; ***P < 0.001 vs. DPSCs alone; §§§P < 0.001 vs. DPSCs after RA rPBMCs co-culture. C Western blot analyses of caspase 3 and PCNA in RA aPBMCs alone and after co-culture with DPSCs. Histograms reveal statistically significant differences in cleaved caspase 3 and PCNA expression in RA aPBMCs after DPSCs co-culture; *P < 0.05 vs. RA aPBMCs alone. SC consisted in cleaved-caspase 3 positive control. Data are expressed as mean ± SD and analyzed by one-way ANOVA followed by Newman-Keuls post-hoc test

References

    1. Pisciotta A, Bertoni L, Vallarola A, Bertani G, Mecugni D, Carnevale G. Neural crest derived stem cells from dental pulp and tooth-associated stem cells for peripheral nerve regeneration. Neural Regen Res. 2020;15(3):373–381. - PMC - PubMed
    1. Carnevale G, Pisciotta A, Riccio M, Bertoni L, De Biasi S, Gibellini L, et al. Human dental pulp stem cells expressing STRO-1, c-kit and CD34 markers in peripheral nerve regeneration. J Tissue Eng Regen Med. 2018;12(2):e774–e785. - PubMed
    1. Zordani A, Pisciotta A, Bertoni L, Bertani G, Vallarola A, Giuliani D, et al. Regenerative potential of human dental pulp stem cells in the treatment of stress urinary incontinence: In vitro and in vivo study. Cell Prolif. 2019;52(6):e12675. - PMC - PubMed
    1. Pisciotta A, Riccio M, Carnevale G, Lu A, De Biasi S, Gibellini L, et al. Stem cells isolated from human dental pulp and amniotic fluid improve skeletal muscle histopathology in mdx/SCID mice. Stem Cell Res Ther. 2015;6(1):1–15. - PMC - PubMed
    1. Caplan AI. Mesenchymal stem cells: time to change the name! Stem Cells Transl Med. 2017;6(6):1445–1451. - PMC - PubMed

Publication types