Review
. 2022 Feb 3;82(3):514-526.
doi: 10.1016/j.molcel.2021.11.007. Epub 2021 Dec 3.

Compendium of human transcription factor effector domains

Affiliations
Review

Compendium of human transcription factor effector domains

Luis F Soto et al. Mol Cell. .

Abstract

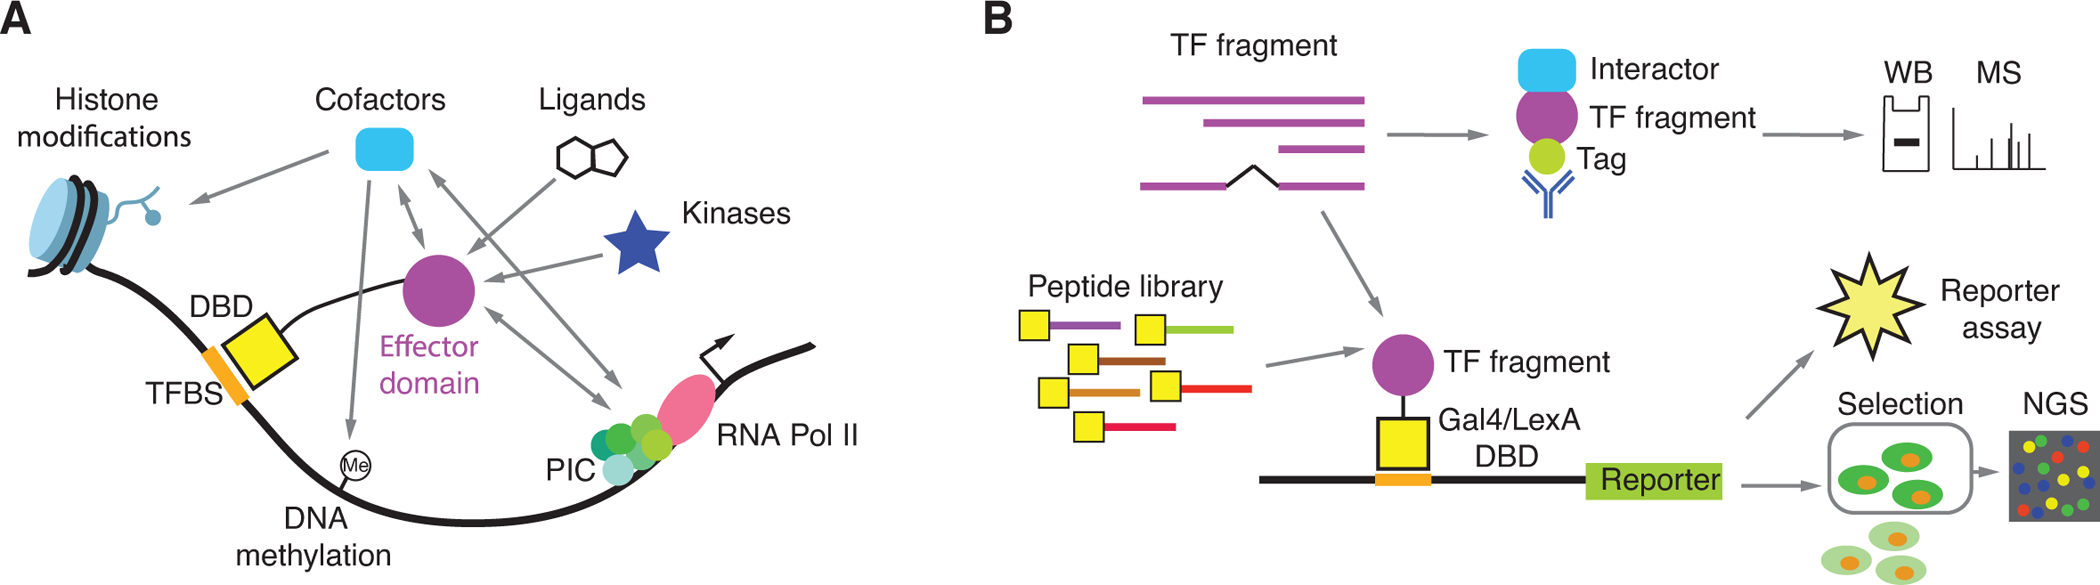
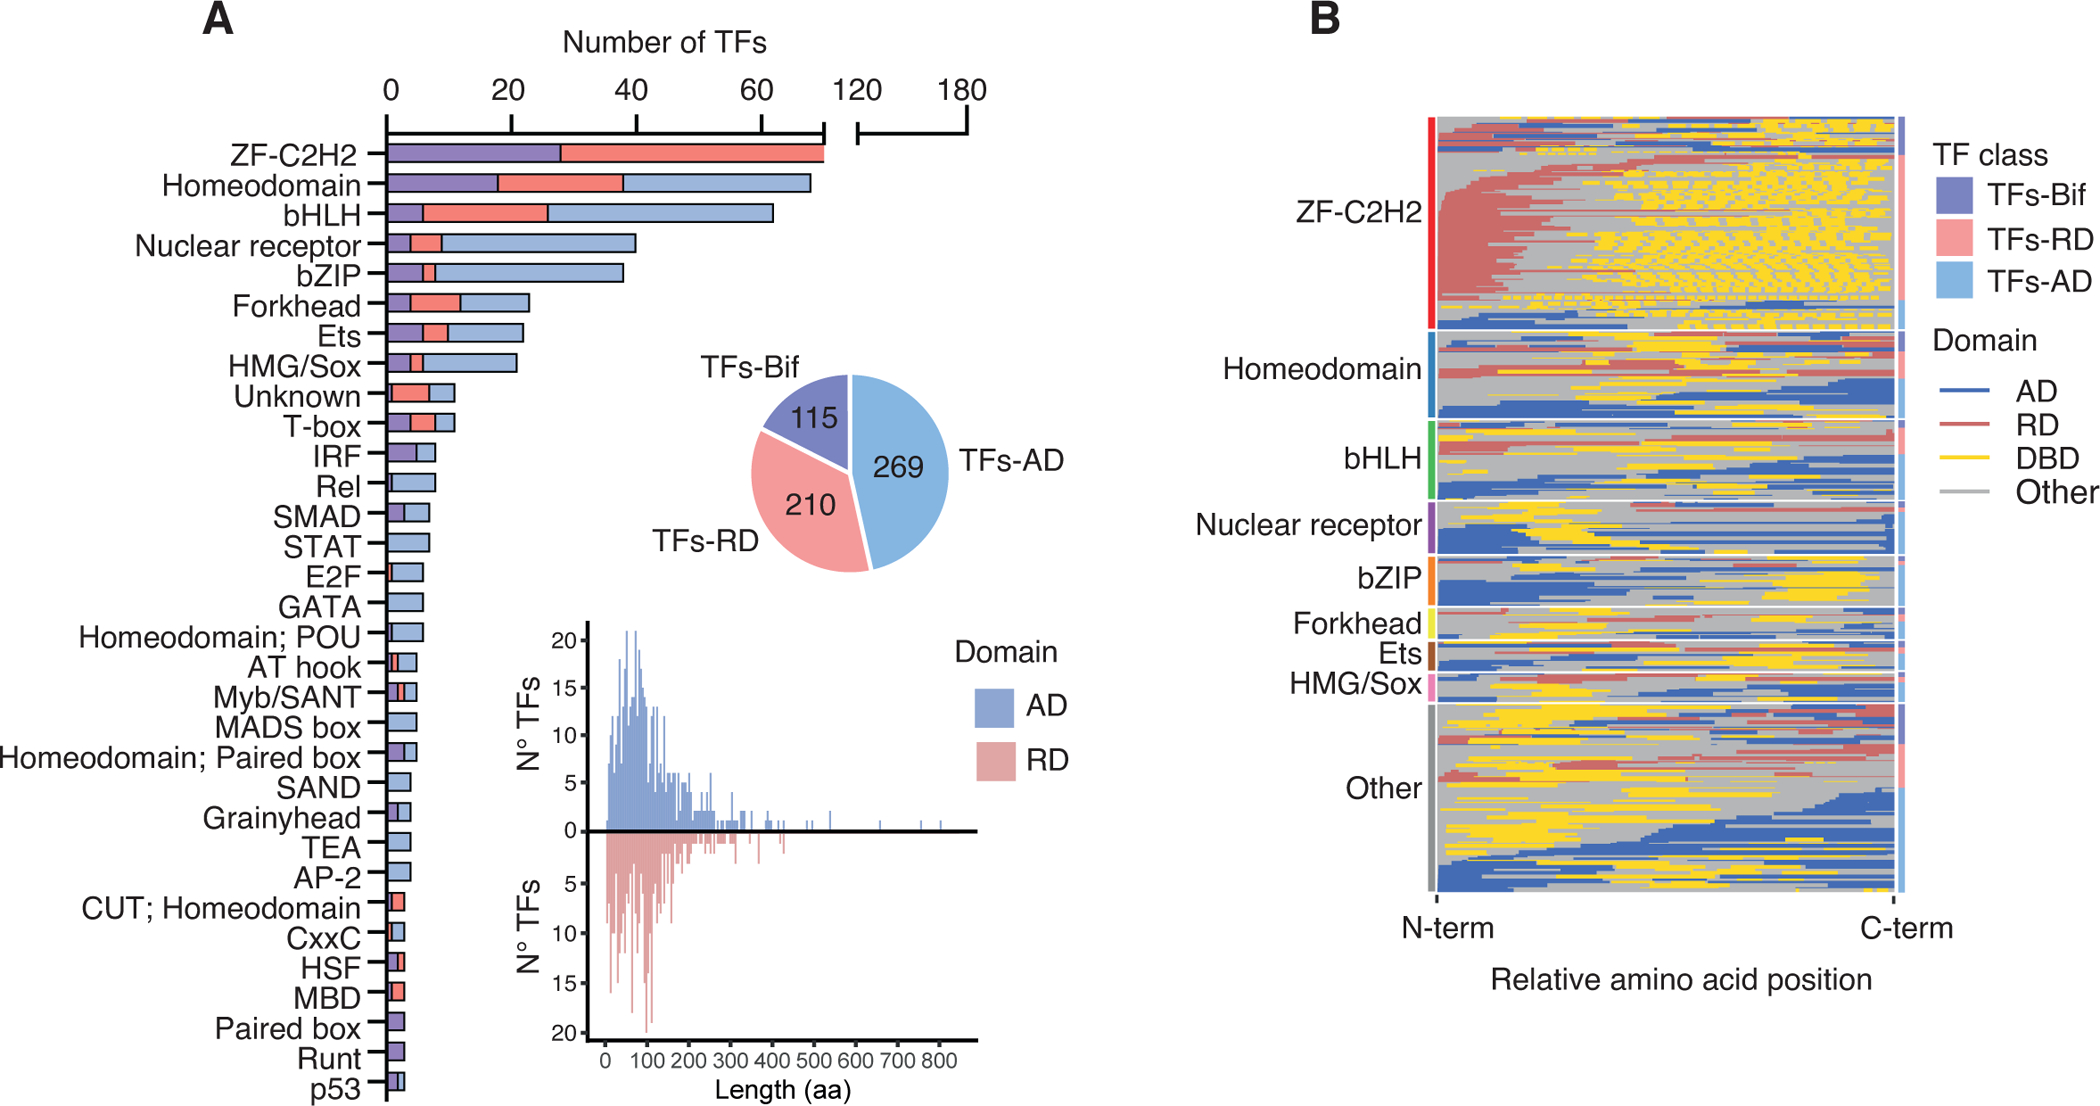
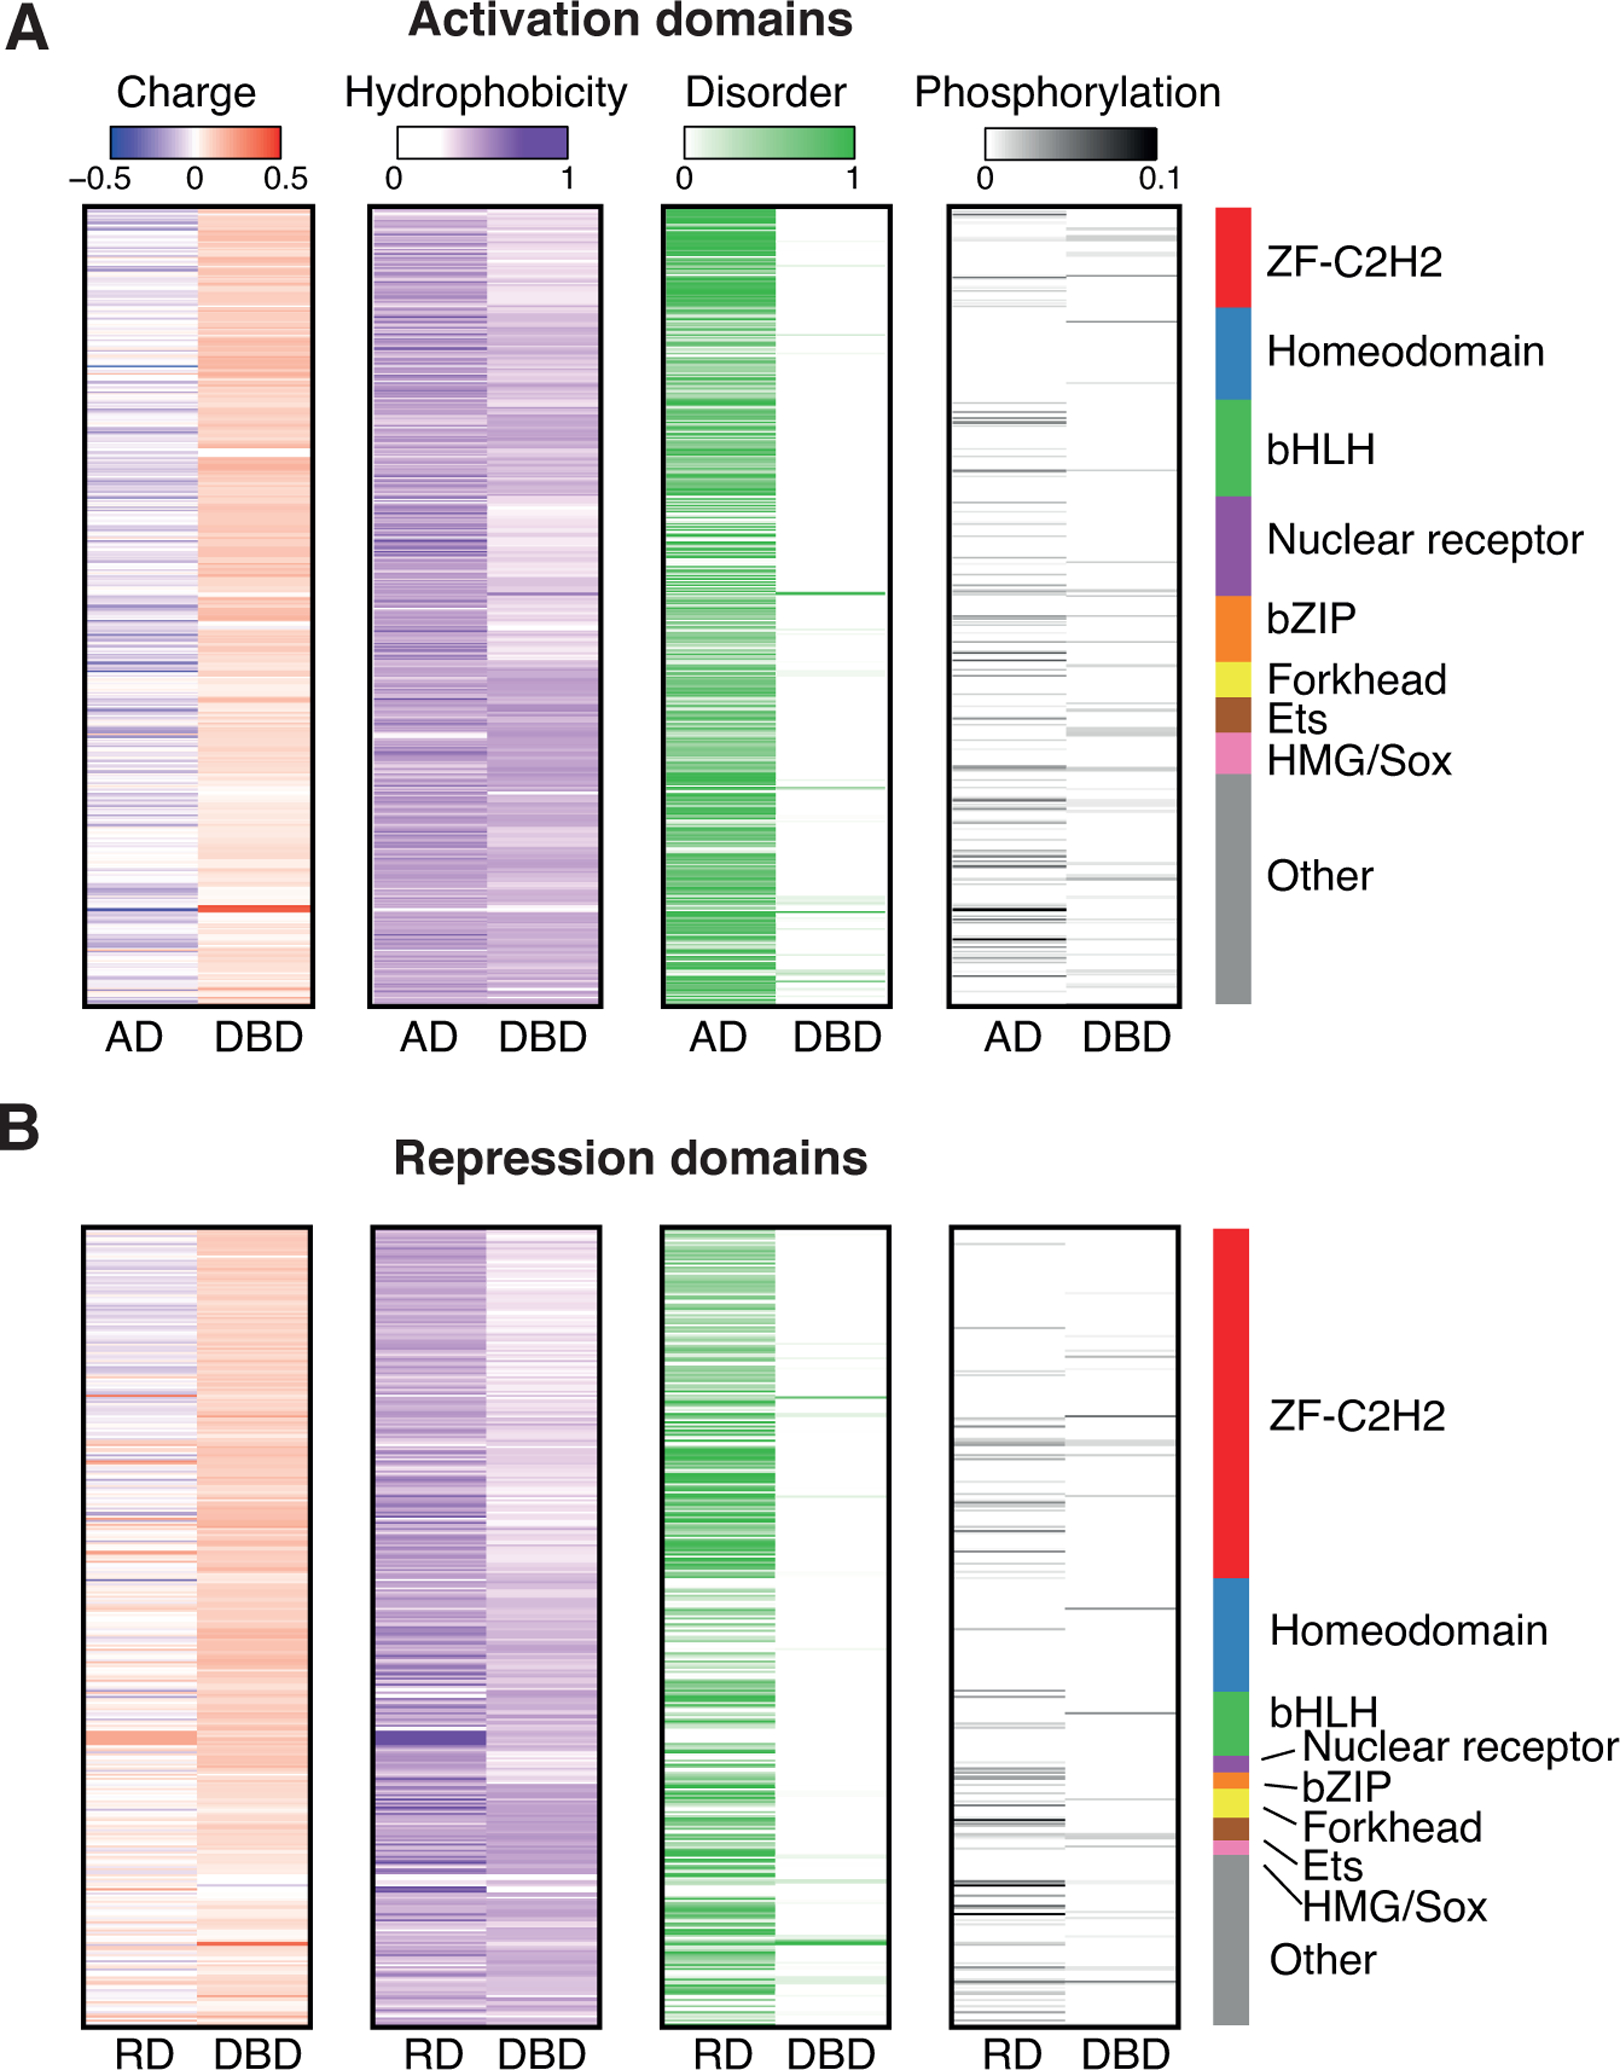
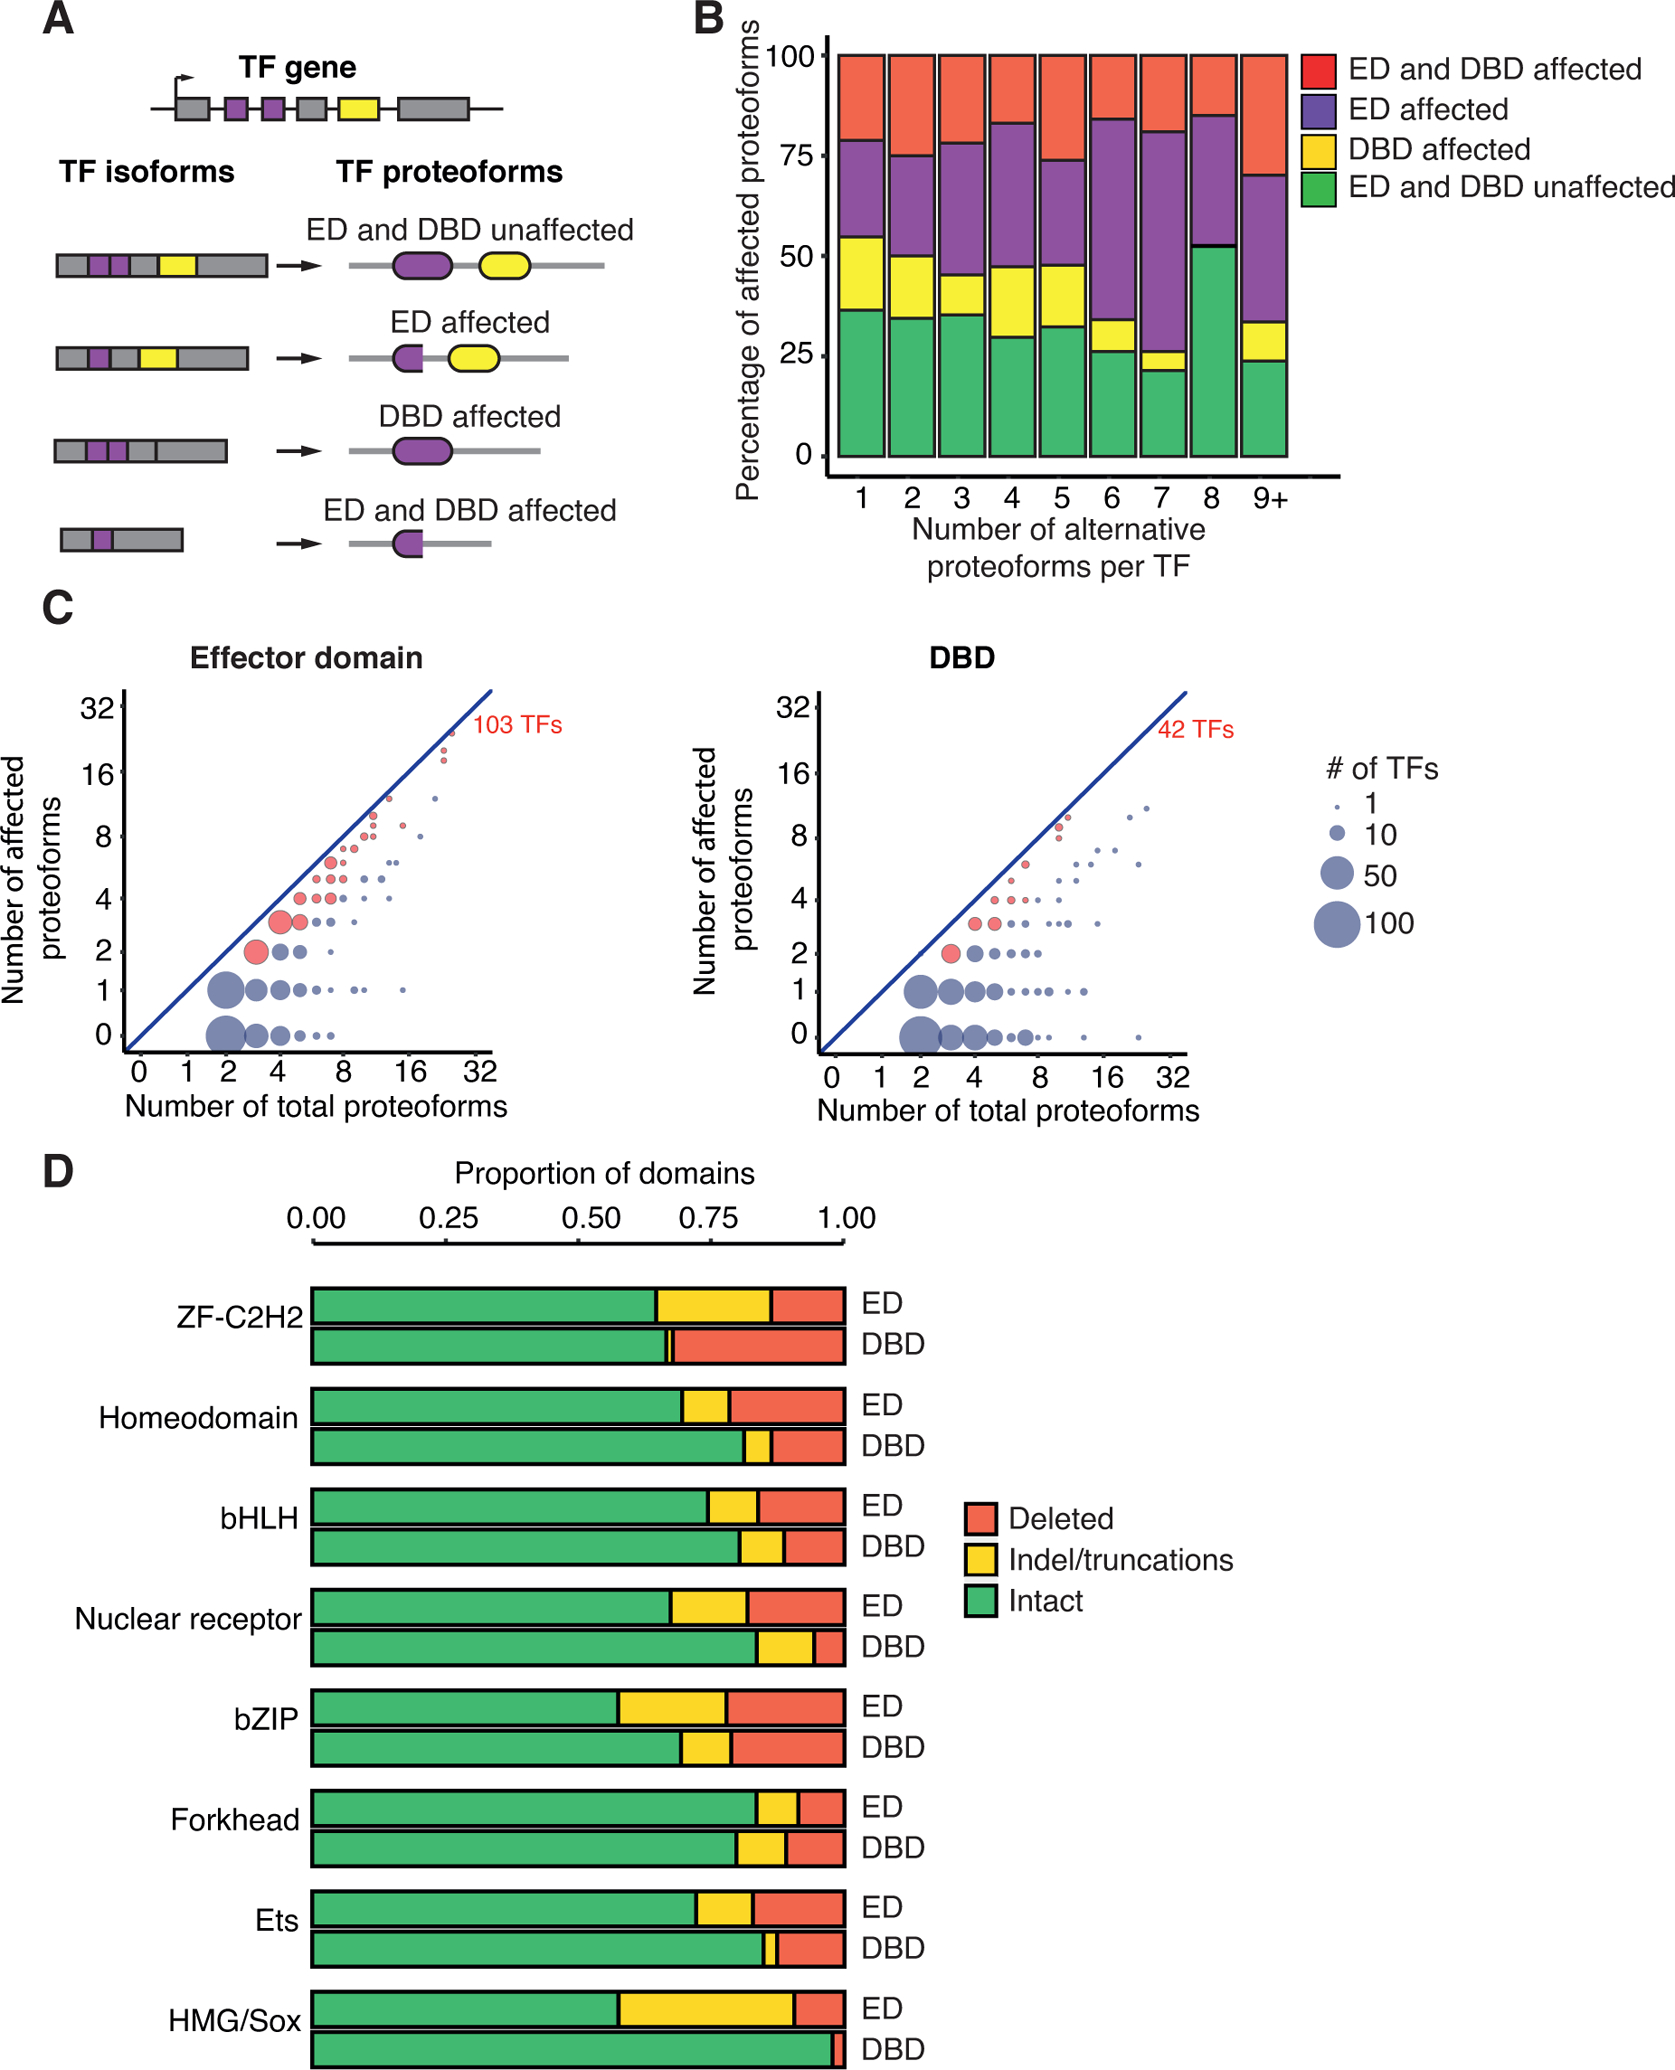
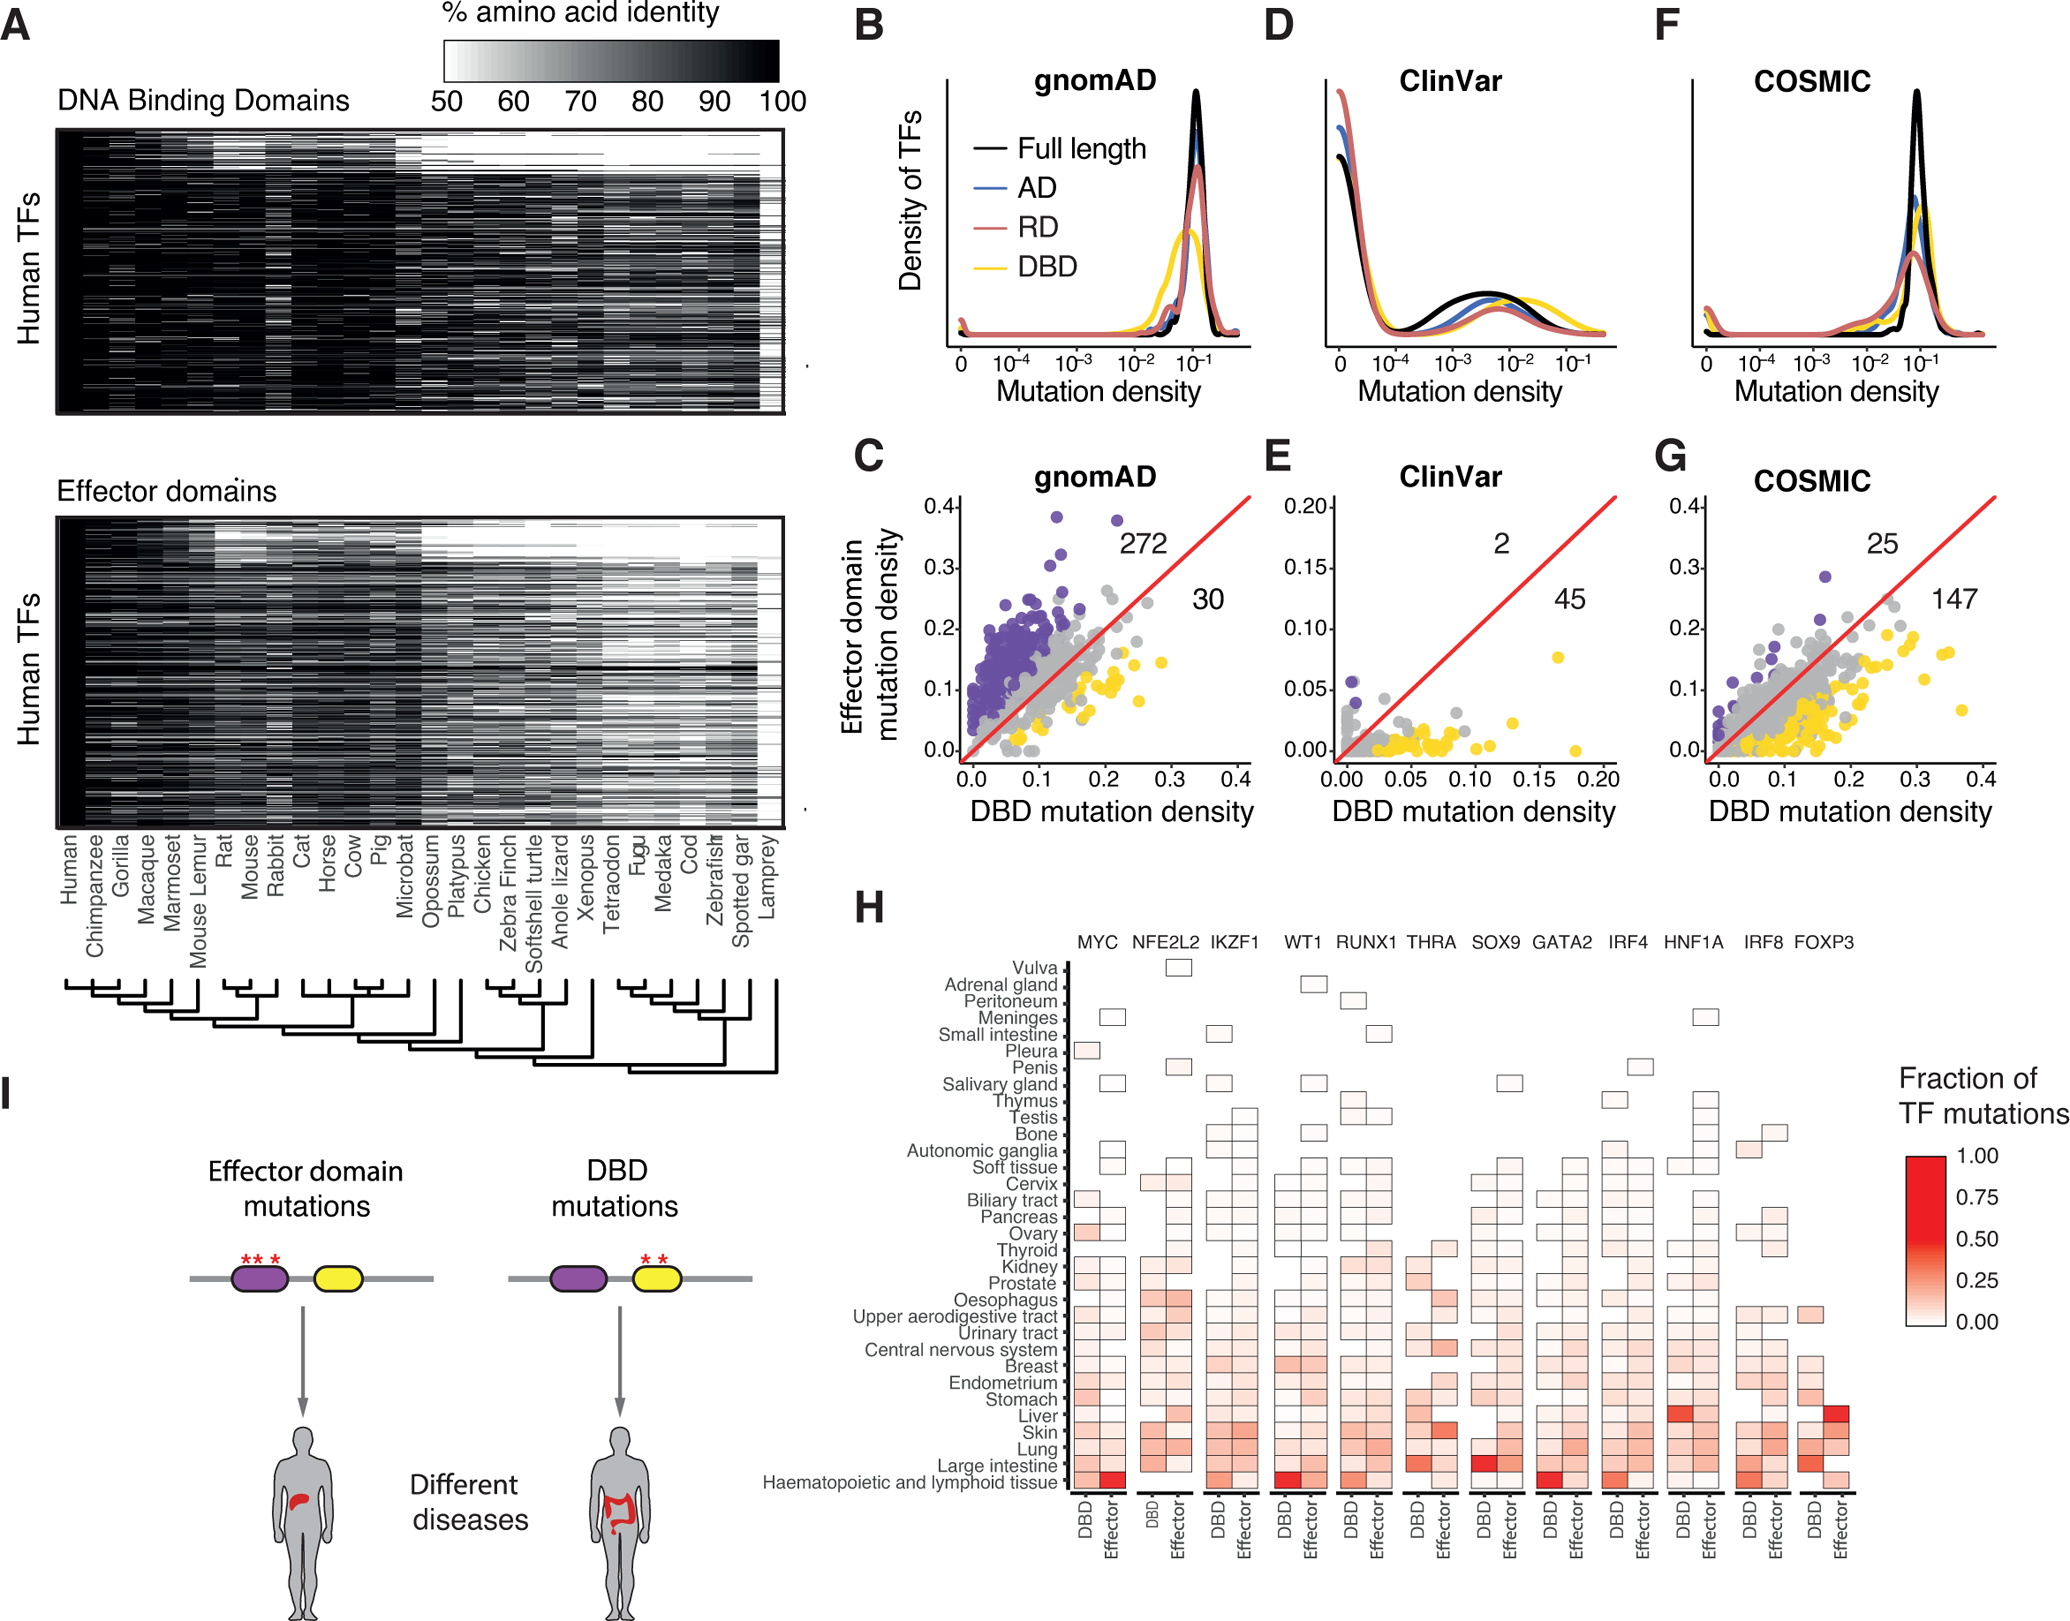
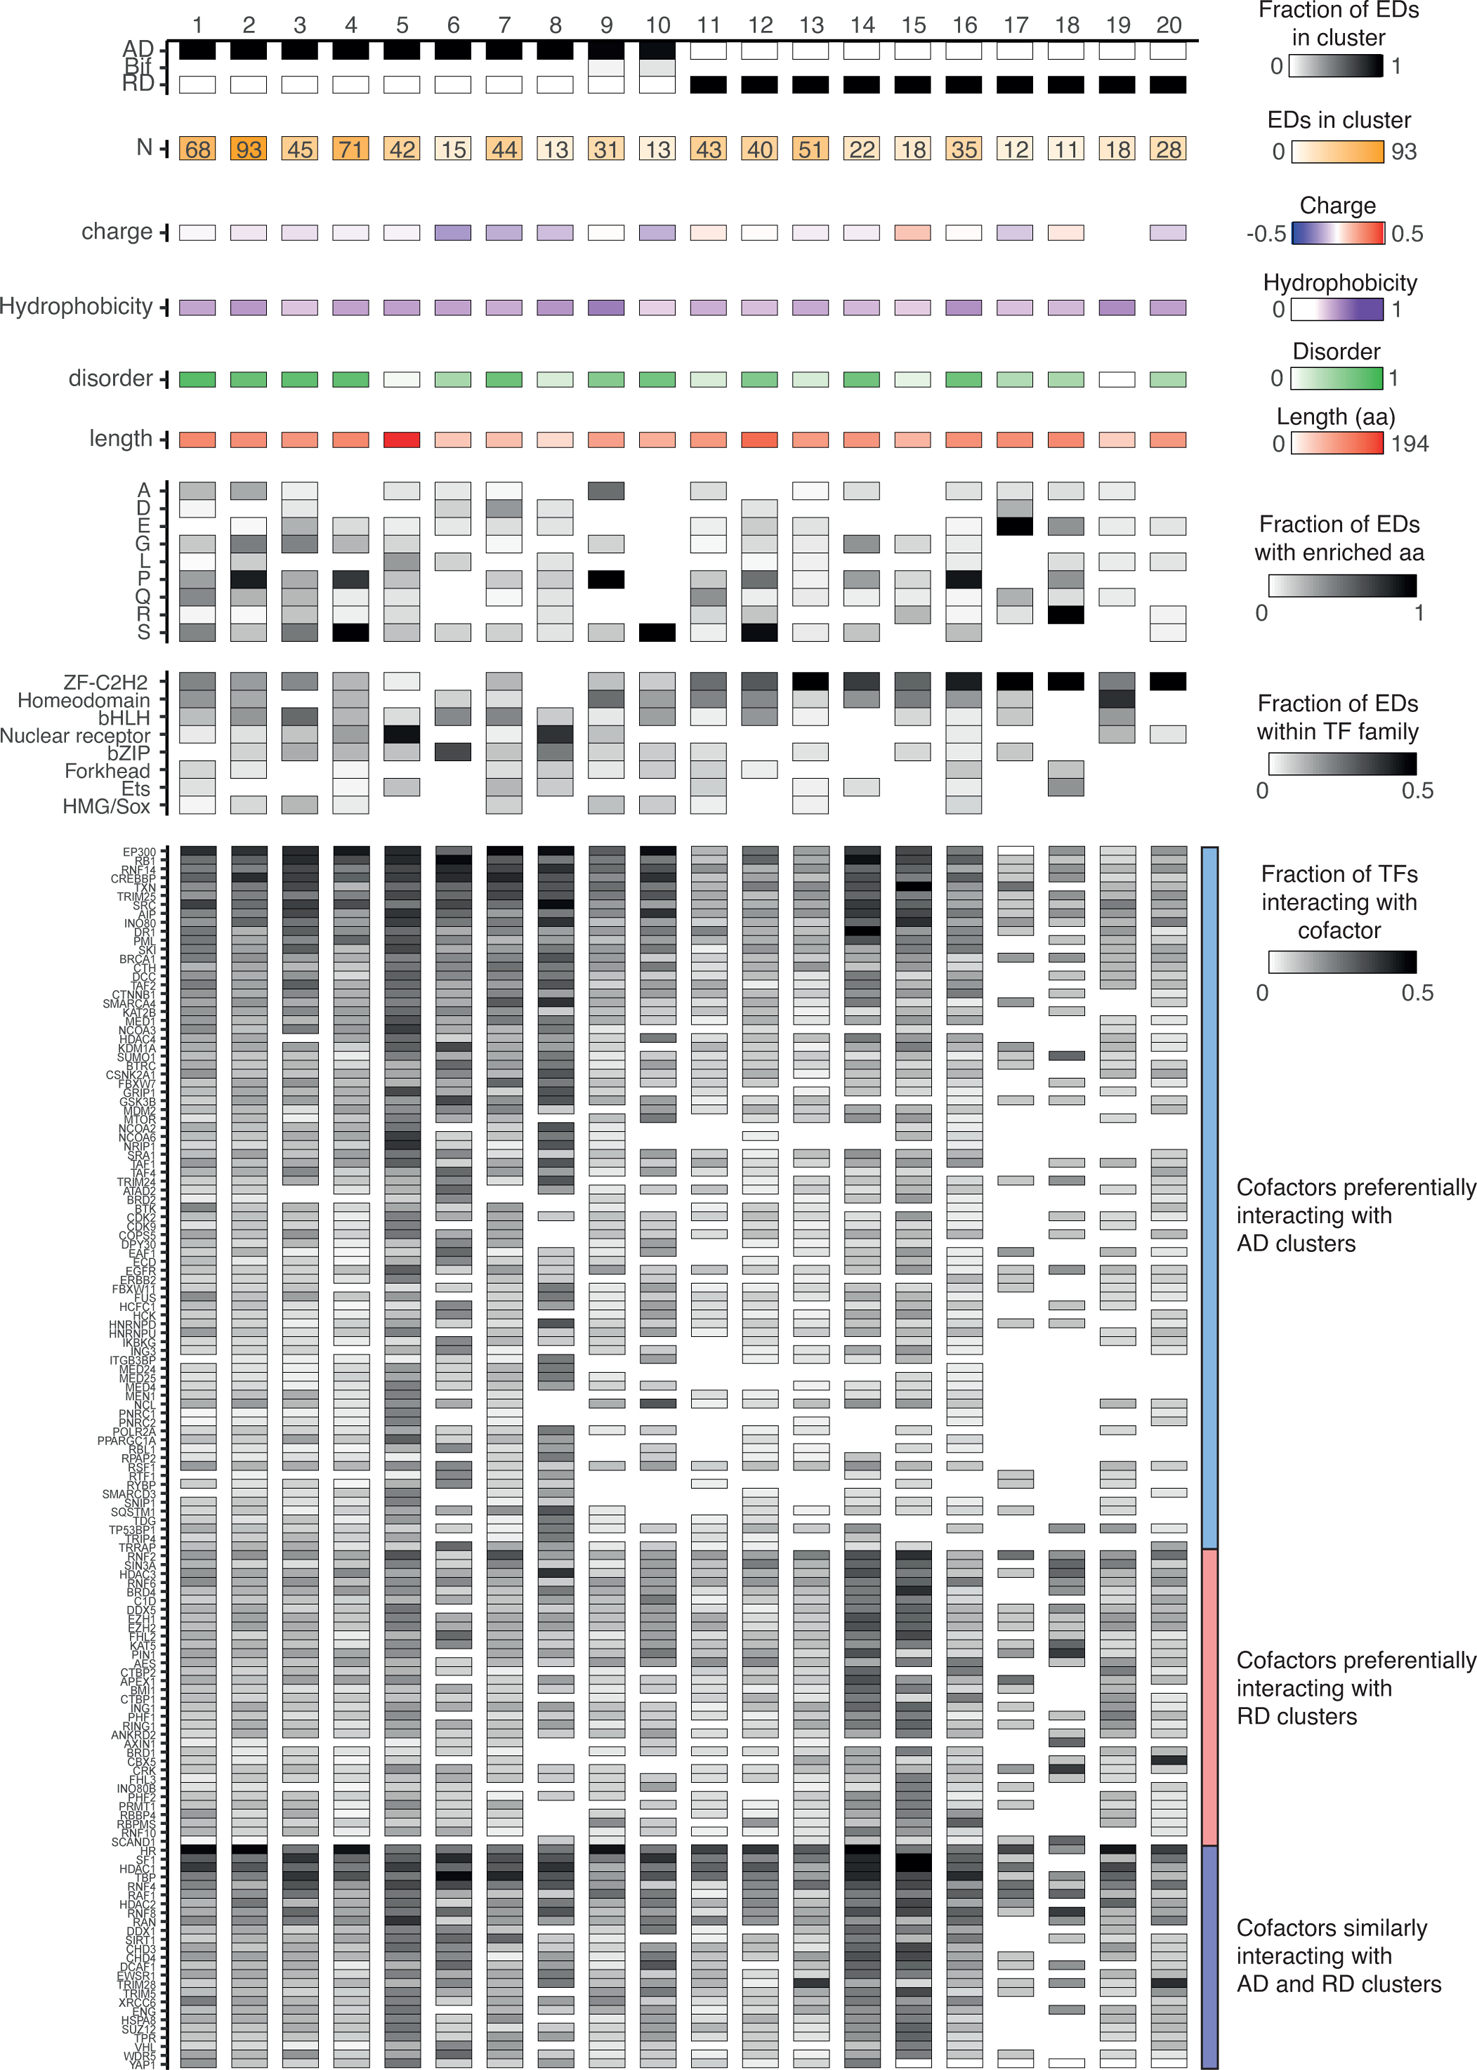
Transcription factors (TFs) regulate gene expression by binding to DNA sequences and modulating transcriptional activity through their effector domains. Despite the central role of effector domains in TF function, there is a current lack of a comprehensive resource and characterization of effector domains. Here, we provide a catalog of 924 effector domains across 594 human TFs. Using this catalog, we characterized the amino acid composition of effector domains, their conservation across species and across the human population, and their roles in human diseases. Furthermore, we provide a classification system for effector domains that constitutes a valuable resource and a blueprint for future experimental studies of TF effector domain function.


Conflict of interest statement

Declaration of interests The authors declare no competing interests.

Figures

Figure 1.
Figure 1.. Effector domain identification, characterization, and function.
(A) Effector domains can affect gene expression by interacting with cofactors and the preinitiation complex, by directly modifying histone tails, and by leading to changes in DNA methylation states. The activity of some effector domains can be affected by interactions with ligands or by post-translational modifications. (B) Experimental approaches to identify and characterize effector domains. TF fragments or pool peptide libraries comprised of tilling, random, or mutated peptides are fused to an exogenous DBD (e.g., Gal4, Gcn4, LexA, or rTetR DBDs). Transcriptional activity is often measure using a reporter gene. In the case of high-throughput peptide screens cells with different levels of reporter activity are sorted and the enrichment for sequence coding each peptide is determined by next generation sequencing (NGS).
Figure 2.
Figure 2.. Distribution of effector domains.
(A) Number of TFs per family with annotated effector domains classified as TFs-AD (if they only have ADs annotated), TFs-RD (if the only have RDs annotated), and TFs-Bif (if they have both ADs and RDs or bifunctional domains annotated). Only TF families with 3 or more annotated TFs are included. The pie chart indicates the number of TFs in each class. The histogram indicates the amino acid length distribution for ADs (blue) and RDs (red). (B) Relative position of ADs, RDs and DBDs within the TF amino acid sequence (from N- to C-termini). TF families are indicated by the left bars. Within each family TFs are sorted based on whether they are classified as TFs-Bif, TFs-RD, or TFs-AD (indicated by the right bars). Within each class, TFs are sorted by the relative position of the effector domain in the TF sequence. See also Figure S1.
Figure 3.
Figure 3.. Sequence features of effector domains
(A-B) For each activation domain (A) and repression domain (B) the charge density (charge / amino acid length), hydrophobicity, disorder (determined using AlphaFold), and phosphorylation density (number of phosphorylation events / amino acid length) are indicated. See also Figures S2 and S3.
Figure 4.
Figure 4.. Effector domains affected in TF proteoforms
(A) Schematic of different proteoforms with effector domain (ED) affected, DBD affected, or with both domains affected o unaffected. Purple rectangles indicate ED coding exons; yellow rectangles indicate DBD coding exon; purple and yellow ovals indicate the ED and DBD, respectively. (B) Fraction of proteoforms with effector domain (ED), DBD, or both domains affected. TFs are binned based on the number of alternative proteoforms. (C) Comparison between the number of proteoforms where the effector domain (left) or the DBD (right) are affected versus the total number of proteoforms of a TF. The size of the circles indicates the number of TFs. Red circles indicate TFs with more that 50% of proteoforms with domain affected domain. (D) Proportion of effector domains (ED) and DBDs where the domains are intact, have indels, or are deleted across proteofoms for each TF family. See also Figure S4.
Figure 5.
Figure 5.. Effector domain conservation and association with disease
(A) Conservation of DBDs and effector domains between human and 27 vertebrate species. The percentage amino acid identity of the corresponding domains between the human sequence and the sequence in the indicated species is shown in shades of gray. The evolutionary relation among species is indicated as a phylogenetic tree. (B, D, F) Density distributions of the number of mutations in the indicated domains per coding sequence length for variants reported in gnomAD (B), and mutations reported in ClinVar (D) and COSMIC (F). (C, E, G) Correlation between the density of mutations in DBDs and effector domains in gnomAD (C), ClinVar (E), and COSMIC (G). Purple and yellow dots indicate TFs with significant enrichment of mutations in effector domains and DBDs, respectively. Significant TFs were identified by a Fisher’s exact test followed by BH correction and q-value < 0.1 as a cutoff. The numbers above and below the diagonal indicate the number of purple and yellow dots, respectively. (H) Fraction of mutations in the DBD and effector domain for each indicated TF that have been detected in the indicated cancer types. Each column sums one. (I) Schematic showing that mutations in effector domains and DBDs could lead to different diseases. See also Figure S5.
Figure 6.
Figure 6.. Classification of effector domains
Effector domains were classified into 20 clusters based on biophysical features, amino acid enrichment, and sequence similarity. The number of effector domains per cluster is indicated in shades of orange. The charge density, hydrophobicity, and disorder were determined as in Figure 2. The length in amino acids is indicated in shades of red. The fractions of effector domains per cluster enriched in each amino acid, TF family, or interacting with a cofactor are indicated in shades of gray. Cofactors interacting with at least 20% of TFs in at least one cluster are shown. See also Figure S6.

References

    1. 1000 Genomes Project Consortium, Auton A, Brooks LD, Durbin RM, Garrison EP, Kang HM, Korbel JO, Marchini JL, McCarthy S, McVean GA, et al. (2015). A global reference for human genetic variation. Nature 526, 68–74. - PMC - PubMed
    1. Alerasool N, Lin ZY, Gingras AC, Taipale M (2021). Identification and functional characterization of transcriptional activators in human cells. BioRxiv. 10.1101/2021.07.30.454360 - DOI - PubMed
    1. Arnold CD, Nemcko F, Woodfin AR, Wienerroither S, Vlasova A, Schleiffer A, Pagani M, Rath M, and Stark A (2018). A high-throughput method to identify trans-activation domains within transcription factor sequences. EMBO J 37. - PMC - PubMed
    1. Barrera LA, Vedenko A, Kurland JV, Rogers JM, Gisselbrecht SS, Rossin EJ, Woodard J, Mariani L, Kock KH, Inukai S, et al. (2016). Survey of variation in human transcription factors reveals prevalent DNA binding changes. Science 351, 1450–1454. - PMC - PubMed
    1. Boija A, Klein IA, Sabari BR, Dall’Agnese A, Coffey EL, Zamudio AV, Li CH, Shrinivas K, Manteiga JC, Hannett NM, et al. (2018). Transcription Factors Activate Genes through the Phase-Separation Capacity of Their Activation Domains. Cell 175, 1842–1855 e1816. - PMC - PubMed

Publication types