. 2022 Feb;298(2):101464.
doi: 10.1016/j.jbc.2021.101464. Epub 2021 Dec 2.

Insight into the molecular basis of substrate recognition by the wall teichoic acid glycosyltransferase TagA

Affiliations

Insight into the molecular basis of substrate recognition by the wall teichoic acid glycosyltransferase TagA

Orlando E Martinez et al. J Biol Chem. 2022 Feb.

Abstract

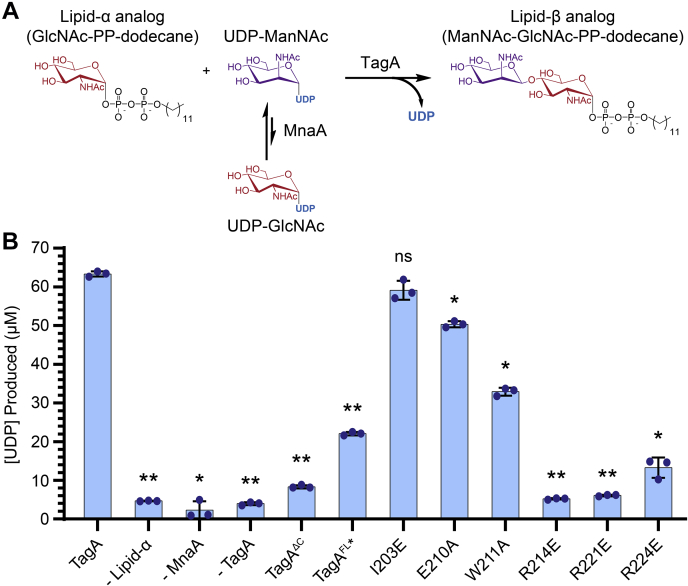
Wall teichoic acid (WTA) polymers are covalently affixed to the Gram-positive bacterial cell wall and have important functions in cell elongation, cell morphology, biofilm formation, and β-lactam antibiotic resistance. The first committed step in WTA biosynthesis is catalyzed by the TagA glycosyltransferase (also called TarA), a peripheral membrane protein that produces the conserved linkage unit, which joins WTA to the cell wall peptidoglycan. TagA contains a conserved GT26 core domain followed by a C-terminal polypeptide tail that is important for catalysis and membrane binding. Here, we report the crystal structure of the Thermoanaerobacter italicus TagA enzyme bound to UDP-N-acetyl-d-mannosamine, revealing the molecular basis of substrate binding. Native MS experiments support the model that only monomeric TagA is enzymatically active and that it is stabilized by membrane binding. Molecular dynamics simulations and enzyme activity measurements indicate that the C-terminal polypeptide tail facilitates catalysis by encapsulating the UDP-N-acetyl-d-mannosamine substrate, presenting three highly conserved arginine residues to the active site that are important for catalysis (R214, R221, and R224). From these data, we present a mechanistic model of catalysis that ascribes functions for these residues. This work could facilitate the development of new antimicrobial compounds that disrupt WTA biosynthesis in pathogenic bacteria.

Keywords: MS; NMR; TagA; Thermoanaerobacter italicus; X-ray crystallography; glycosyltransferase; methicillin-resistant Staphylococcus aureus; molecular dynamics; peripheral membrane protein; teichoic acid.


Conflict of interest statement

Conflict of interest The authors declare that they have no conflicts of interest with the contents of this article.

Figures

Figure 1
Figure 1
TagA protein constructs and sequence alignment.A, three Thermoanaerobacter italicus TagA proteins were used in this study: TagAΔC, residues M1–G195; TagA, residues M1–R244; and TagAFL∗, residues M1–R244 with four amino-acid substitutions (I203E/L209Q/L212K/I216E). The folded core domain of TagA (blue) and computationally predicted helices (green) in the CTT are shown as horizontal bars. The secondary structure elements are shown with the predicted helices in the tail labeled H10', H11', and H12'. Asterisks indicate the location of the amino-acid substitutions in TagAFL∗. B, primary sequence alignment of select TagA proteins showing the CTT. Residues with high similarity across species are colored as follows: nonpolar (green), basic (blue), acidic (red), aromatic (yellow), and proline (orange). Asterisks indicate the location of the amino-acid substitutions in TagAFL∗, and arrows indicate conserved residues that were altered in this study. CTT, C-terminal tail.
Figure 2
Figure 2
NMR studies of TagA.A, assigned 1H–15N TROSY–HSQC spectrum of TagAΔC, with the center of the spectrum expanded and shown on the right. About 61% of amide residues were assigned for TagAΔC. B, crystal structure of the TagAΔC dimer colored to show amino acids whose chemical shifts were assigned (shaded green). The TagAΔC dimer is shown in cartoon (left) and surface (right) representations (Protein Data Bank code: 5WB4). C, overlays of 1H–15N TROSY–HSQC spectra: TagAΔC alone (left), overlaid with the spectrum of TagA (center, blue) and with spectrum of TagAFL∗ (right, red). HSQC, heteronuclear single quantum coherence; TROSY, transverse relaxation optimized spectroscopy.
Figure 3
Figure 3
A model of the monomeric form of full-length TagA and its use in creating a solubility-enhanced TagA protein.A, TagACM, a computationally derived model of the TagA monomer. Orange bars mapped onto the structure connect coevolving amino acids between the core domain (yellow surface) and the CTT (green cartoon) that were identified using the program RaptorX (41). The thickness of the bars indicates the probability of residues being within 8 Å (50%—thin, 100%—thick). B, surface representation of the crystal structure of the TagAΔC dimer showing coevolving core domain residues in yellow. The predicted CTT binding surface on the monomeric form of the enzyme conflicts with the dimer interface. C, TagACM model showing the location of the nonpolar amino acids (red) that were altered to create the solubility-enhanced protein (TagAFL∗, I203E/L209Q/L212K/I216E). D, SE–AUC experiments of TagAFL∗. Data were collected using three sample concentrations at three rotor speeds: 15,000 (blue), 19,000 (green), and 24,000 (red) rpm. Residuals after fitting the data to a monomer–dimer equilibrium are shown. CTT, C-terminal tail; SE-AUC, sedimentation equilibrium–analytical ultracentrifugation.
Figure 4
Figure 4
Structures of the TagAFL∗:UDP–ManNAc and TagAFL∗:UDP–GlcNAc complexes.A, the asymmetric unit of the TagAFL∗:UDP–ManNAc complex (Protein Data Bank code: 7N41). Protein subunits are shown in red, blue, and green. The protein in the TagAFL∗:UDP–GlcNAc complex (Protein Data Bank: 7MPK) adopts a very similar structure. B, iterative-build 2mFo–DFc composite omit maps showing the location of the UDP–ManNAc (left, yellow) and UDP–GlcNAc (right, cyan and purple) ligands in the TagAFL∗ complexes (contoured at 1.0 σ) (45). UDP–GlcNAc adopts two conformations, 1 and 2, where the sugar is oriented away from or toward the catalytic pocket containing D65. Additional simulated annealing omit maps for the structures are presented in Fig. S3. C, image showing enzyme–substrate interactions in the TagAFL∗:UDP–ManNAc complex. A cartoon representation of the protein is shown in gray. UDP–ManNAc and amino acid side chains are shown in stick format. Amino acid side chains are colored based on the part of the substrate they contact: uracil base (purple), ribose (green), and ManNAc moiety (red). D, electrostatic surface of the substrate binding site in the TagAFL∗:UDP–ManNAc complex. Coloring is as follows: anionic (red), neutral (white), and cationic (blue). GlcNAc, N-acetyl-d-glucosamine; ManNAc, N-acetyl-d-mannosamine.
Figure 5
Figure 5
MD simulations of apo-TagACMand the TagACM:UDP–ManNAc complex.A, a plot showing the root mean square fluctuation (RMSF) differences of TagA backbone coordinates during apo and complex MD simulations. B, representative clusters of the apo-TagACM simulation showing the fluctuations of the C-terminal tail (CTT). The surface of the core domain is colored gray, residues within the catalytic pocket are colored orange, and helices H10'–H12' in the CTT are colored based on their positioning (“in state” [blue, C] or “out state” [red, D]). The UDP–ManNAc binding surface is indicated by yellow arrows. E, representative clusters of the TagACM:UDP–ManNAc complex simulation. The H10' and H11' helices are stable and pack against the core in a conformation that resembles the “in state” observed in the simulation of apo-TagACM. The CTT for each cluster is represented in cartoon format and shaded from light blue to green. F, the surface representation of the primary cluster (cyan) from the complex simulation. Coloring as in panels (BD). Conserved CTT arginine residues (R214, R221, and R224) are colored purple. G, enzyme–substrate contacts observed in the MD simulation of the TagACM:UDP–ManNAc complex. In the two most populated clusters in the trajectory (cluster 1, 51% of the trajectory, cyan; cluster 2, 25% of the trajectory, green), the diphosphate group in UDP–ManNAc interacts with two highly conserved arginine residues, R221 and R224. ManNAc, N-acetyl-d-mannosamine; MD, molecular dynamics.
Figure 6
Figure 6
Enzyme activities of TagA variants.A, schematic of the in vitro enzyme-coupled TagA activity assay. Synthetic lipid-α analog is coincubated with UDP–GlcNAc and an MnaA epimerase before addition of the TagA enzyme. UDP product accumulation is quantified by absorbance at 262 nm. B, a chart of UDP product formation for a series of variants of the Thermoanaerobacter italicus TagA enzyme following an end-point activity assay. Bars labeled “-lipid-α,” “-MnaA,” and “-TagA” indicate assays in which these components were not present. All single amino-acid substitutions were introduced in the native full-length TagA enzyme. Each experiment was performed in technical triplicate, and error bars represent the standard deviation of measurements. The statistical significance (p value) between native TagA and variant activity datasets was determined using the Analysis ToolPak in Microsoft Excel. Asterisks indicate the statistical significance between the activity of native TagA and variant datasets (∗p < 0.005, ∗∗p < 0.0001, and ns). GlcNAc, N-acetyl-d-glucosamine; ns, not significant.
Figure 7
Figure 7
Native MS studies of micelle binding by TagA.A, negative ion mode MS of 10 μM TagA. Deconvoluted mass spectra of TagA with varying concentrations of DDM detergent (critical micelle concentration [CMC]: 170 μM) are shown with monomeric and dimeric peaks identified. B, proposed model of membrane association by TagA based on the results of experimental and computational studies. In solution, TagA exists in a monomer–dimer equilibrium. When a membrane is present, a hydrophobic patch on the CTT that exists only in the monomeric form of the enzyme favorably interacts with the membrane and is stabilizing. As a monomer on the membrane, TagA is poised to bind to its lipid-α substrate. CTT, C-terminal tail; DDM, n-dodecyl-β-d-maltoside.

References

    1. Formstone A., Carballido-Lopez R., Noirot P., Errington J., Scheffers D.J. Localization and interactions of teichoic acid synthetic enzymes in Bacillus subtilis. J. Bacteriol. 2008;190:1812–1821. - PMC - PubMed
    1. Brown S., Santa Maria J.P., Walker S. Wall teichoic acids of gram-positive bacteria. Annu. Rev. Microbiol. 2013;67:313–336. - PMC - PubMed
    1. Sewell E.W.C., Brown E.D. Taking aim at wall teichoic acid synthesis: New biology and new leads for antibiotics. J. Antibiot. 2014;67:43–51. - PubMed
    1. Schade J., Weidenmaier C. Cell wall glycopolymers of Firmicutes and their role as nonprotein adhesins. FEBS Lett. 2016;590:3758–3771. - PubMed
    1. Swoboda J.G., Campbell J., Meredith T.C., Walker S. Wall teichoic acid function, biosynthesis, and inhibition. Chembiochem. 2010;11:35–45. - PMC - PubMed

Publication types

MeSH terms