. 2022 Feb 1;1863(2):148518.
doi: 10.1016/j.bbabio.2021.148518. Epub 2021 Dec 3.

Substrate-dependent differential regulation of mitochondrial bioenergetics in the heart and kidney cortex and outer medulla

Affiliations

Substrate-dependent differential regulation of mitochondrial bioenergetics in the heart and kidney cortex and outer medulla

Namrata Tomar et al. Biochim Biophys Acta Bioenerg. .

Abstract

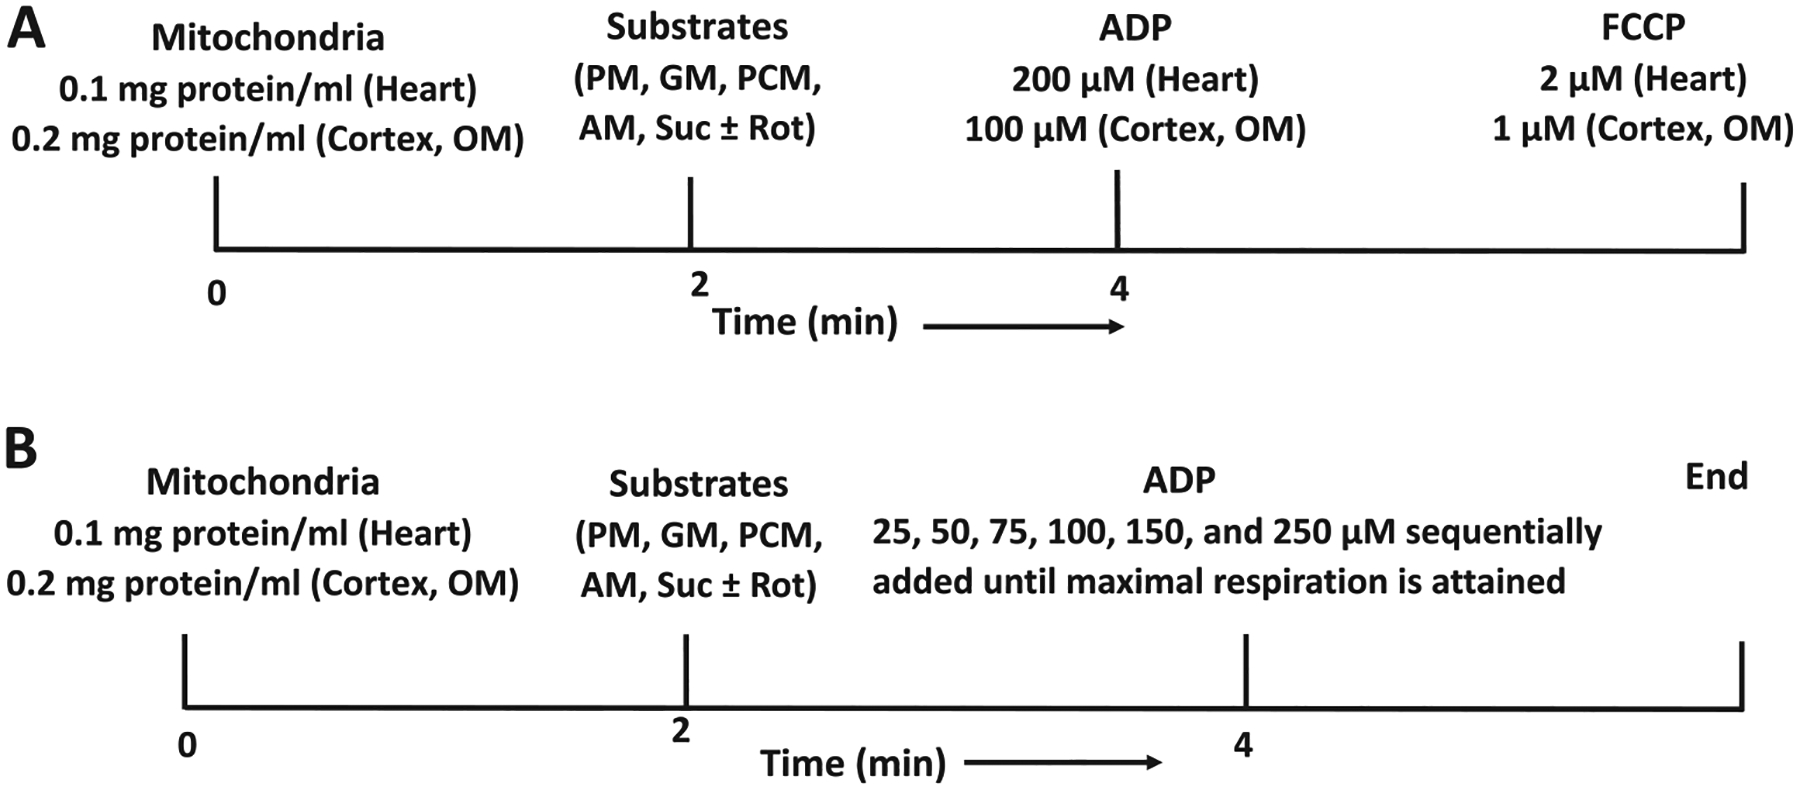
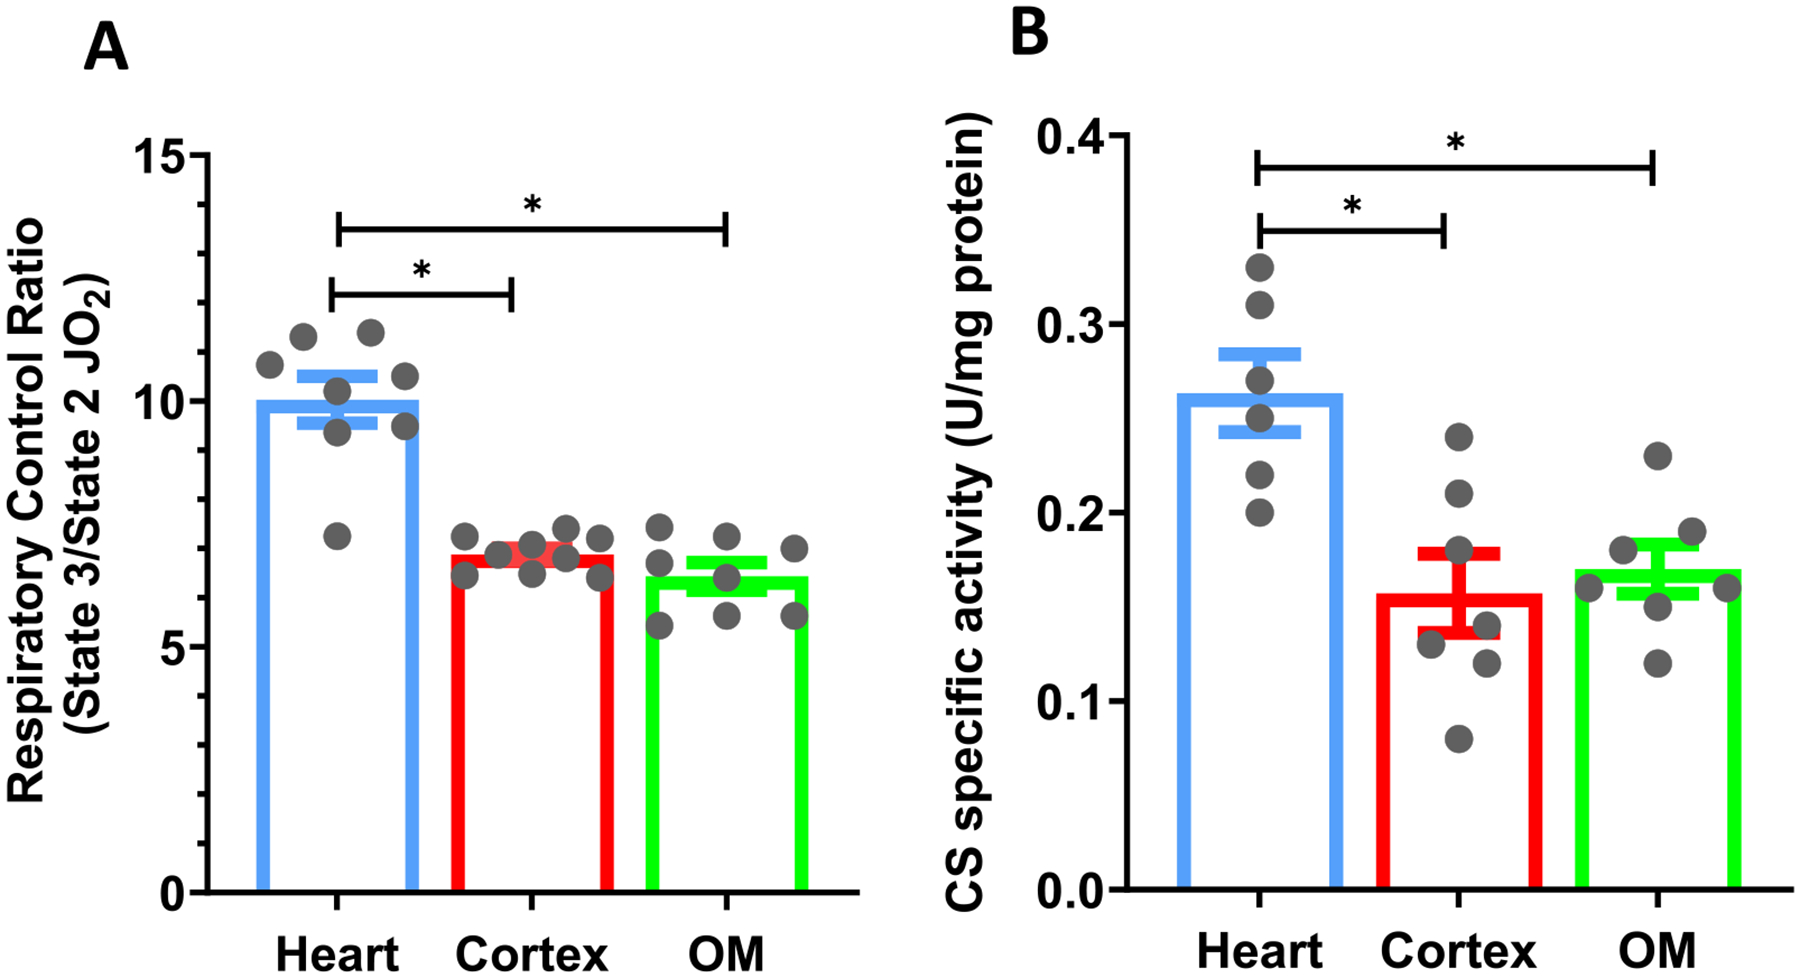
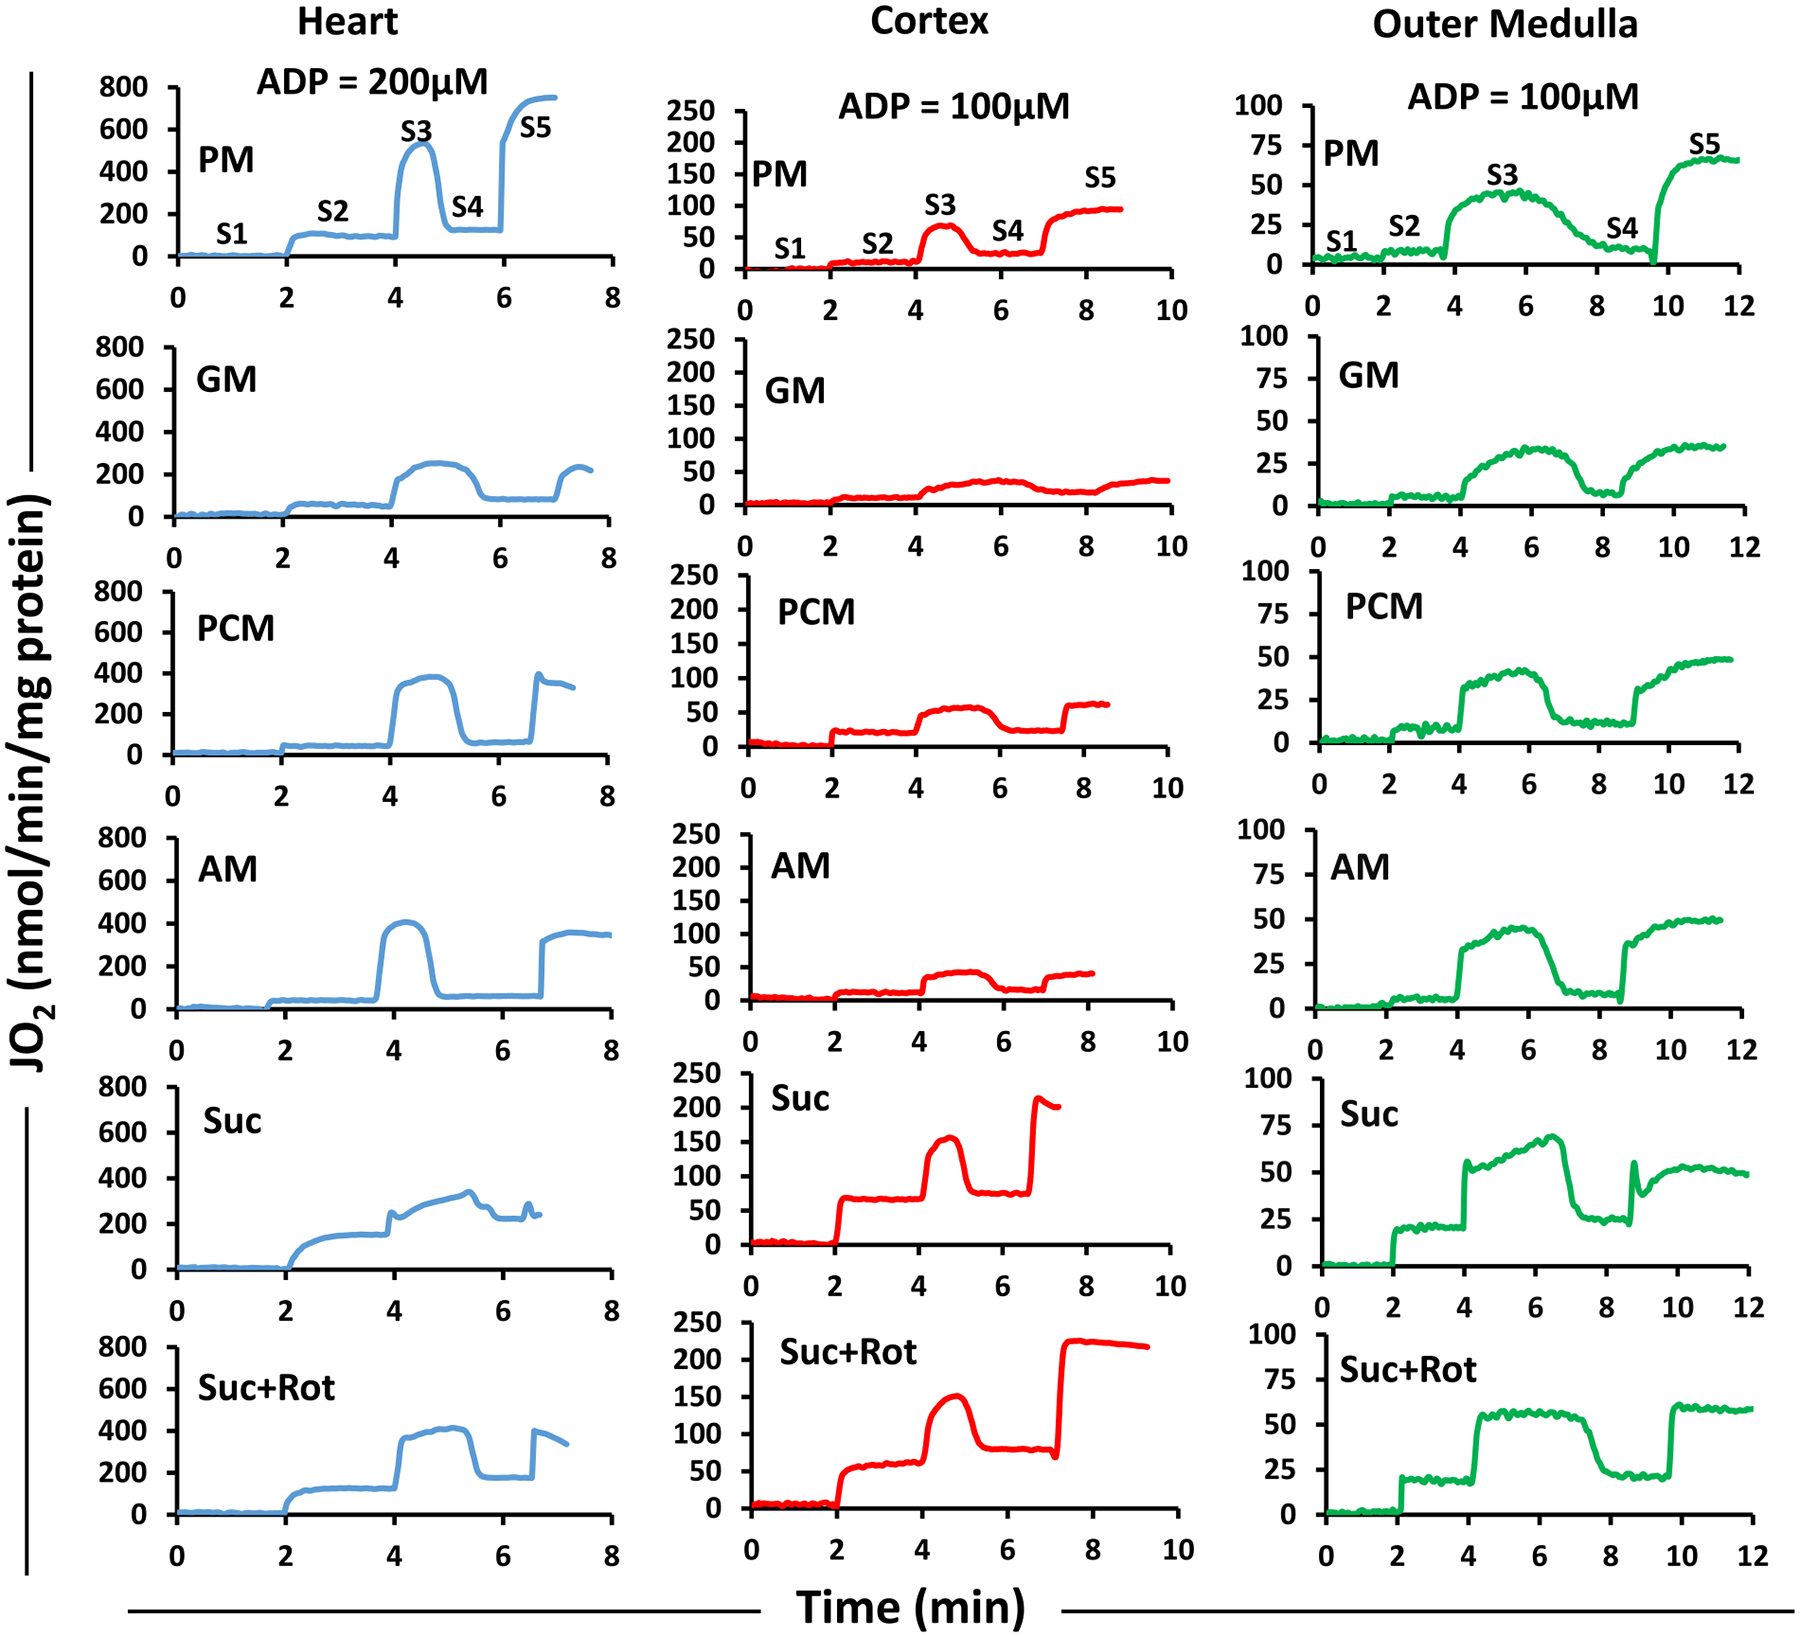
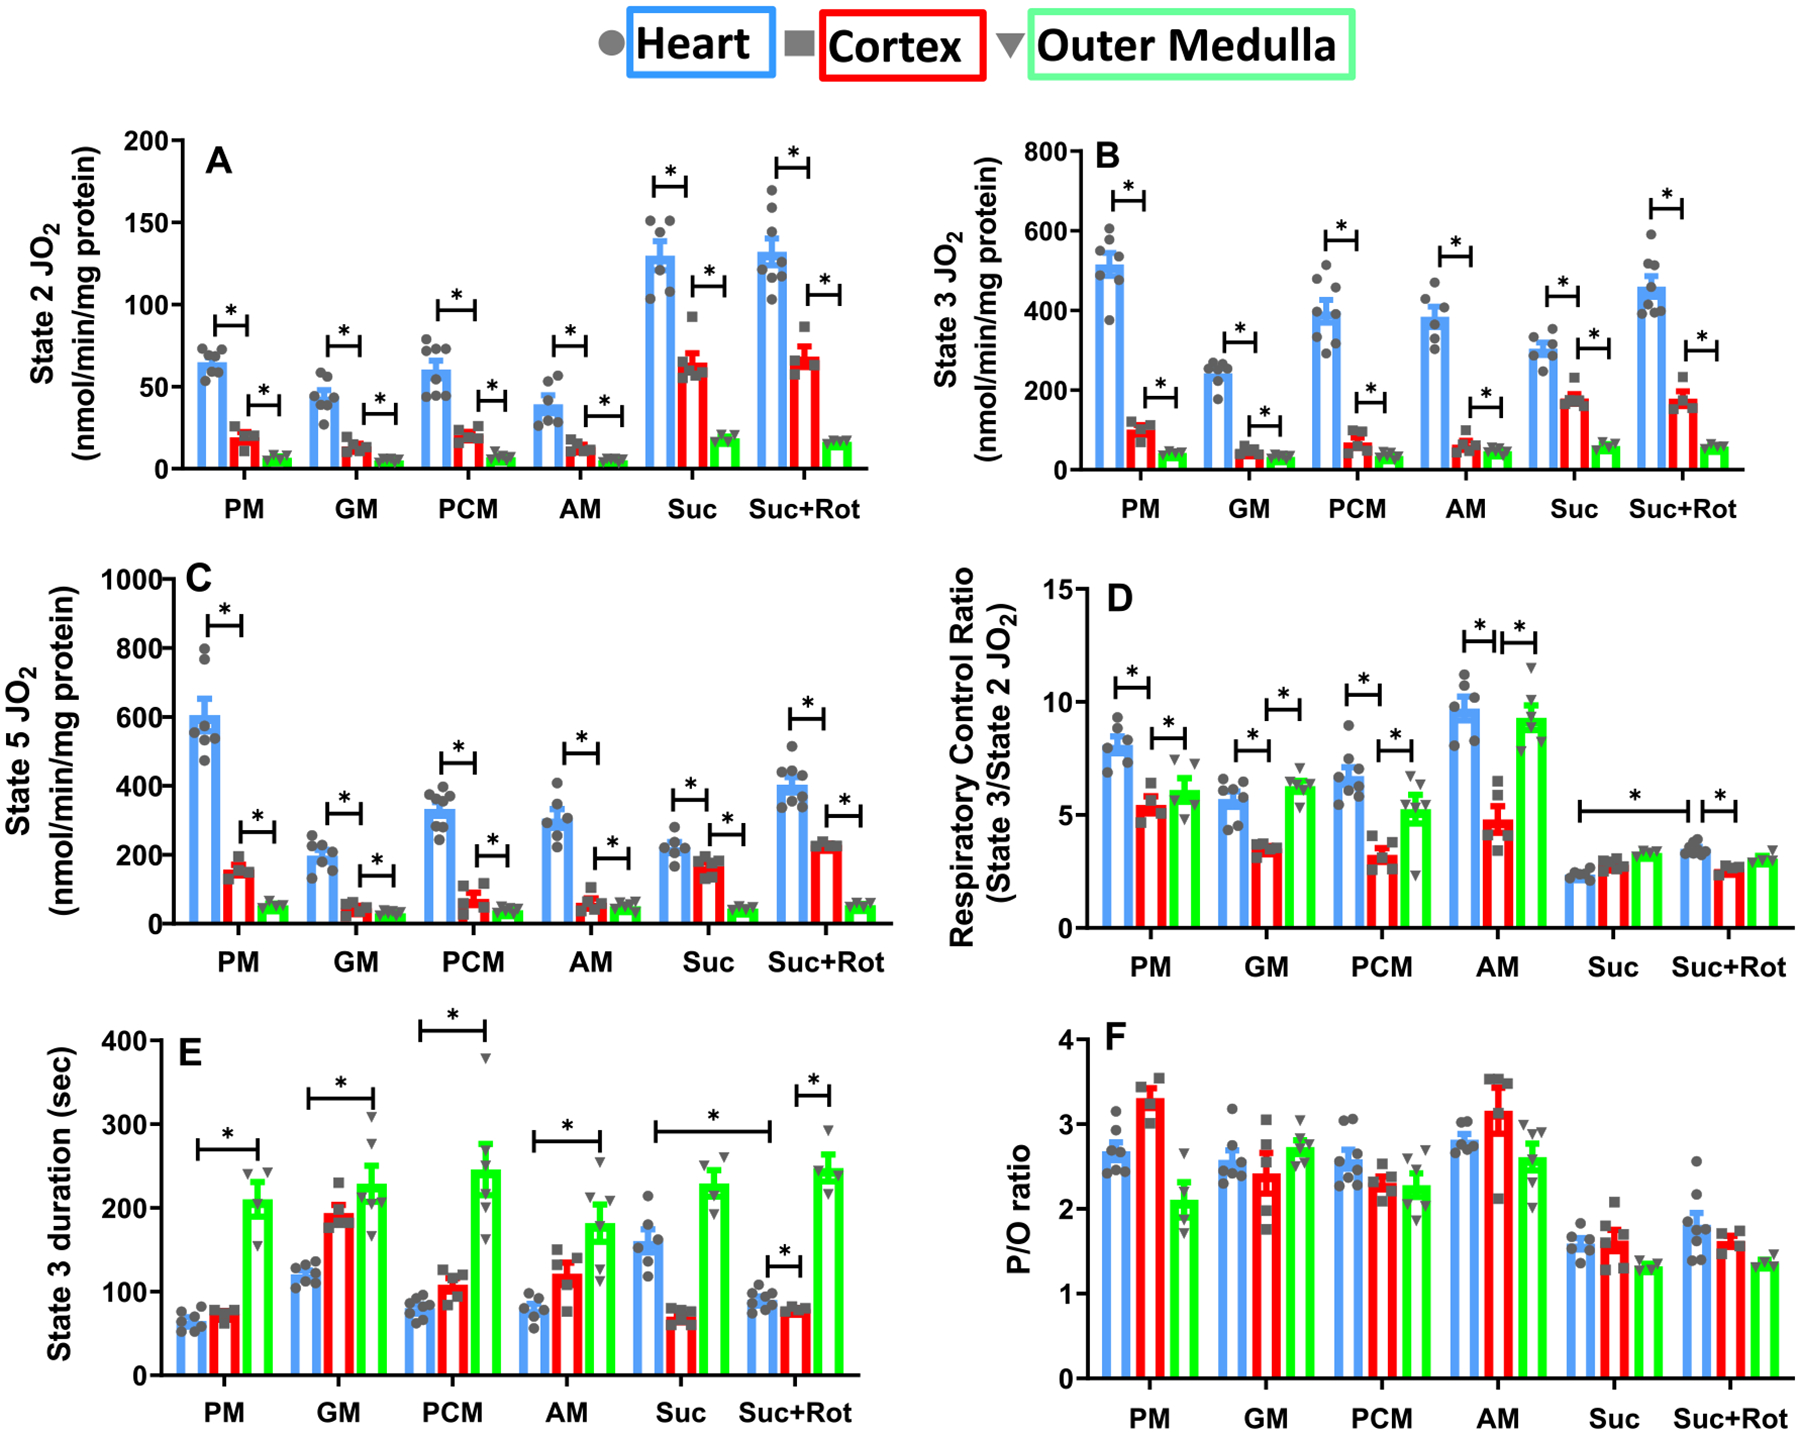
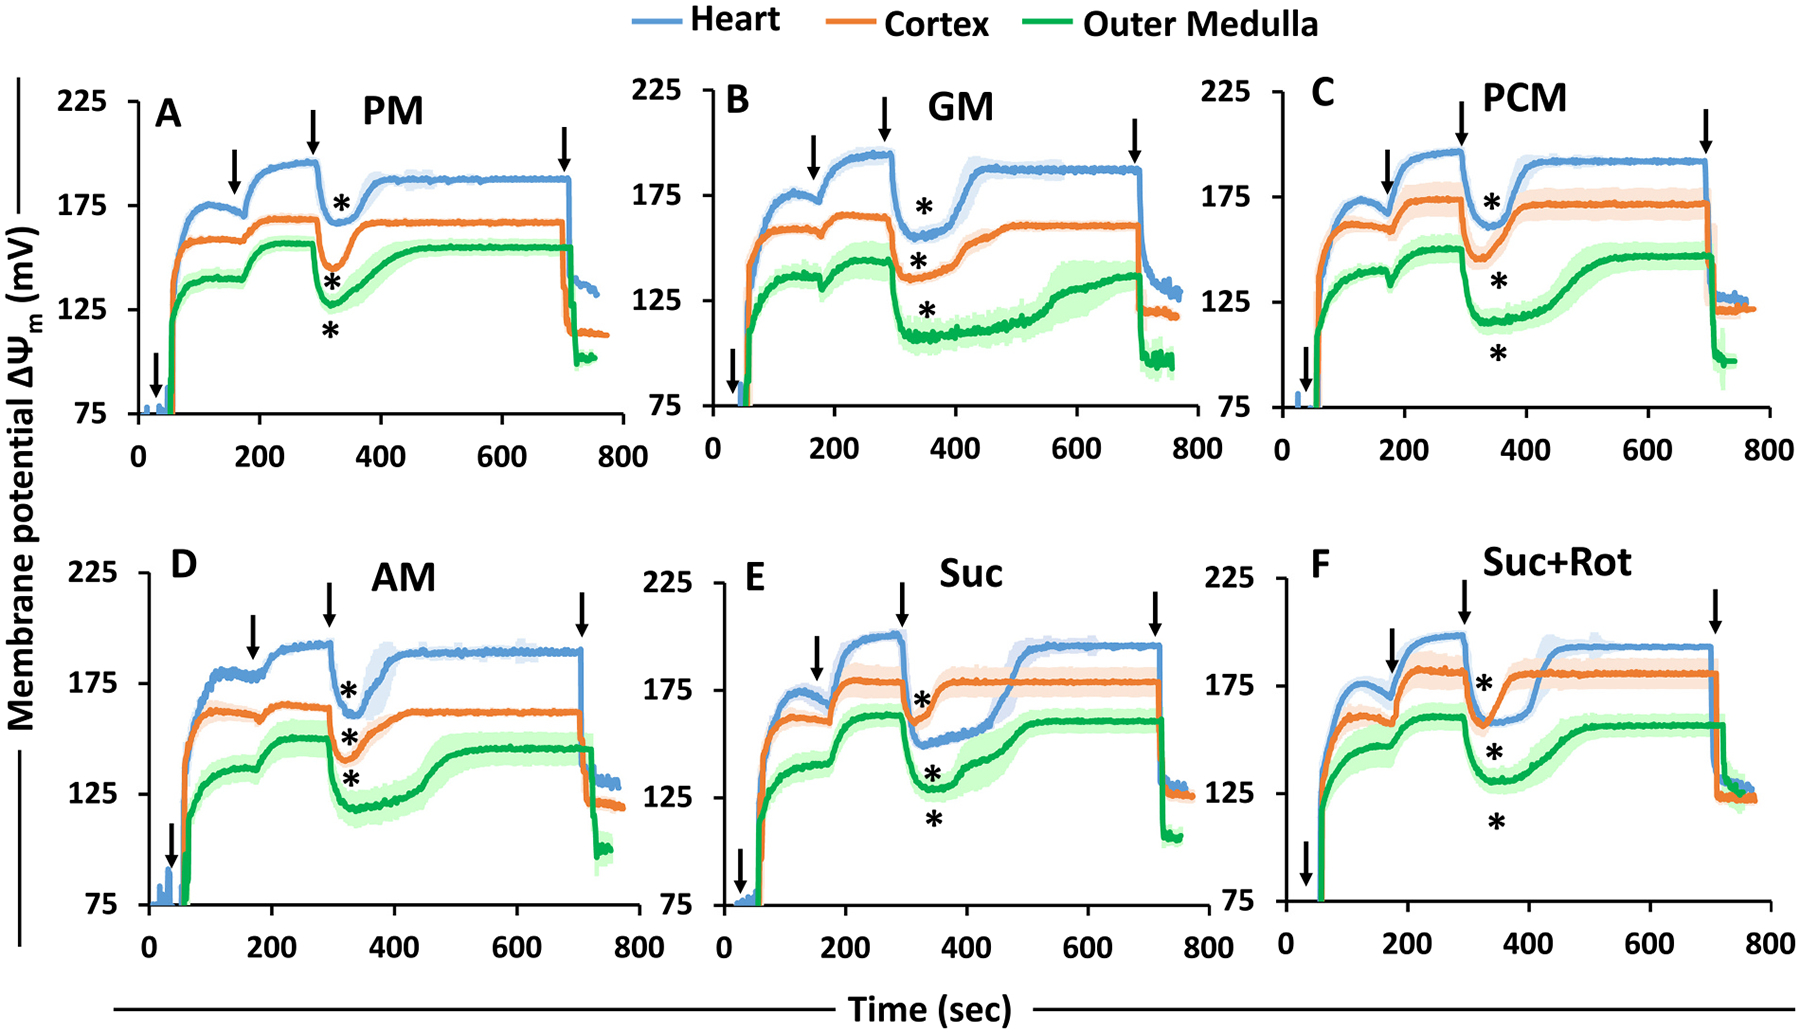
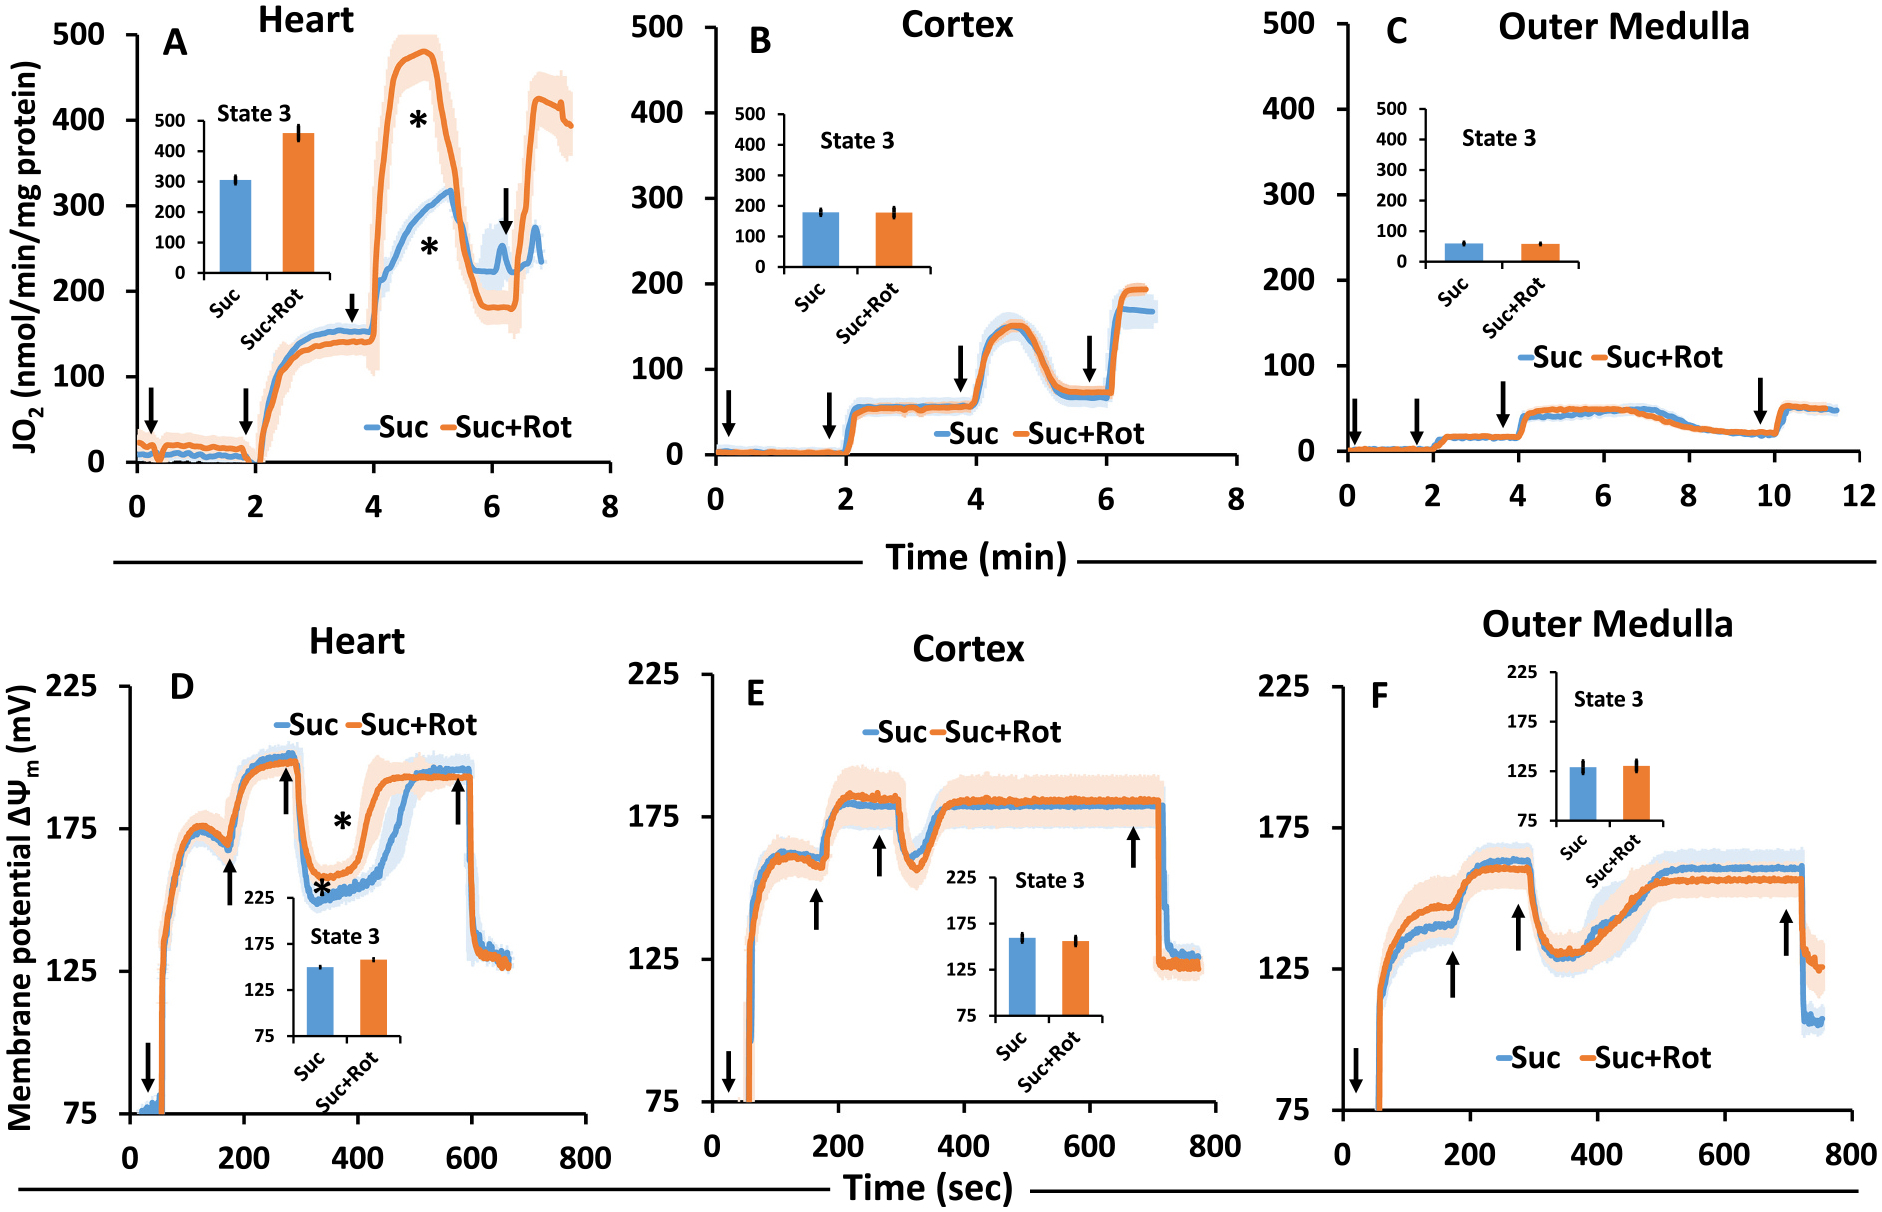
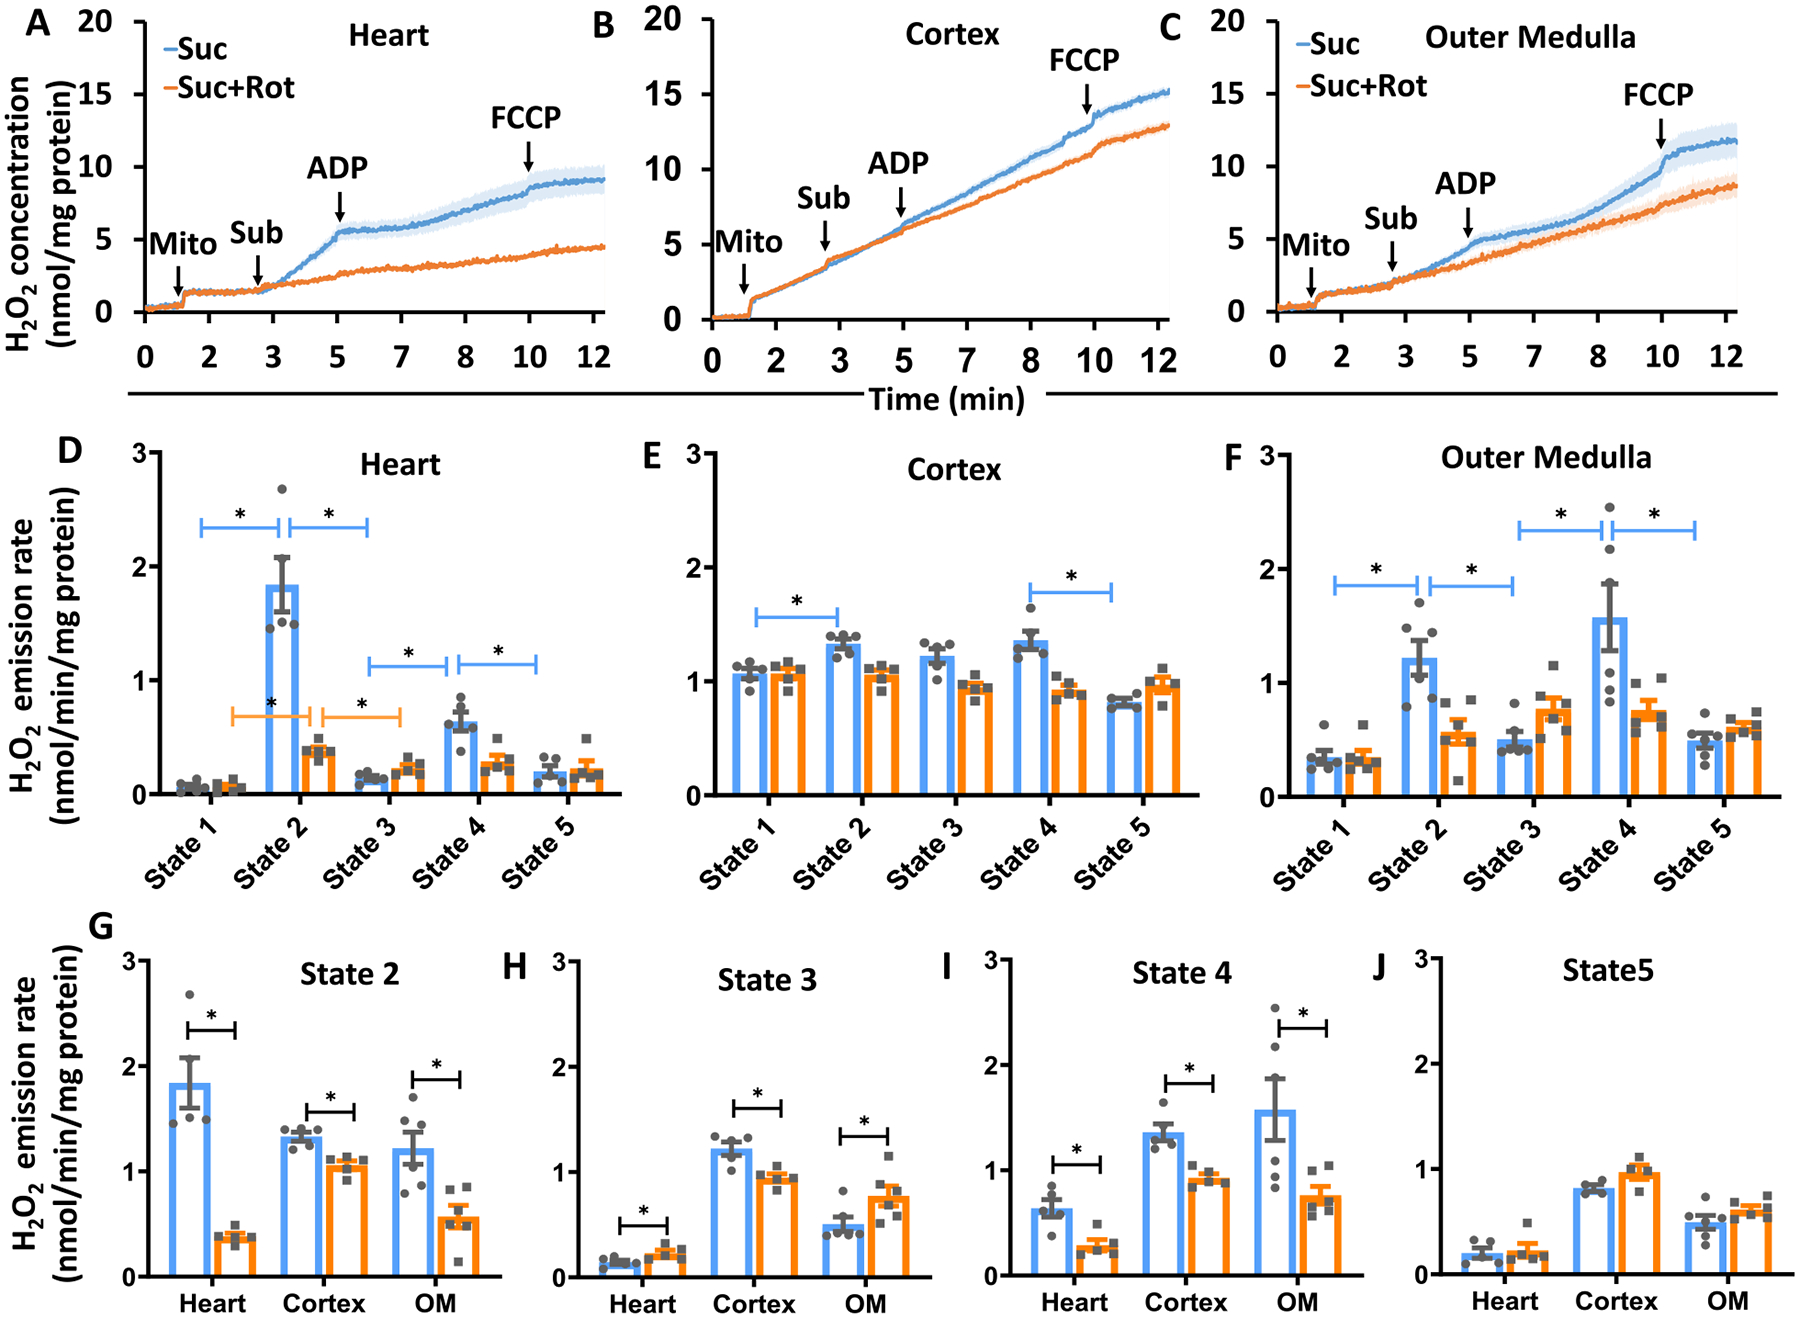
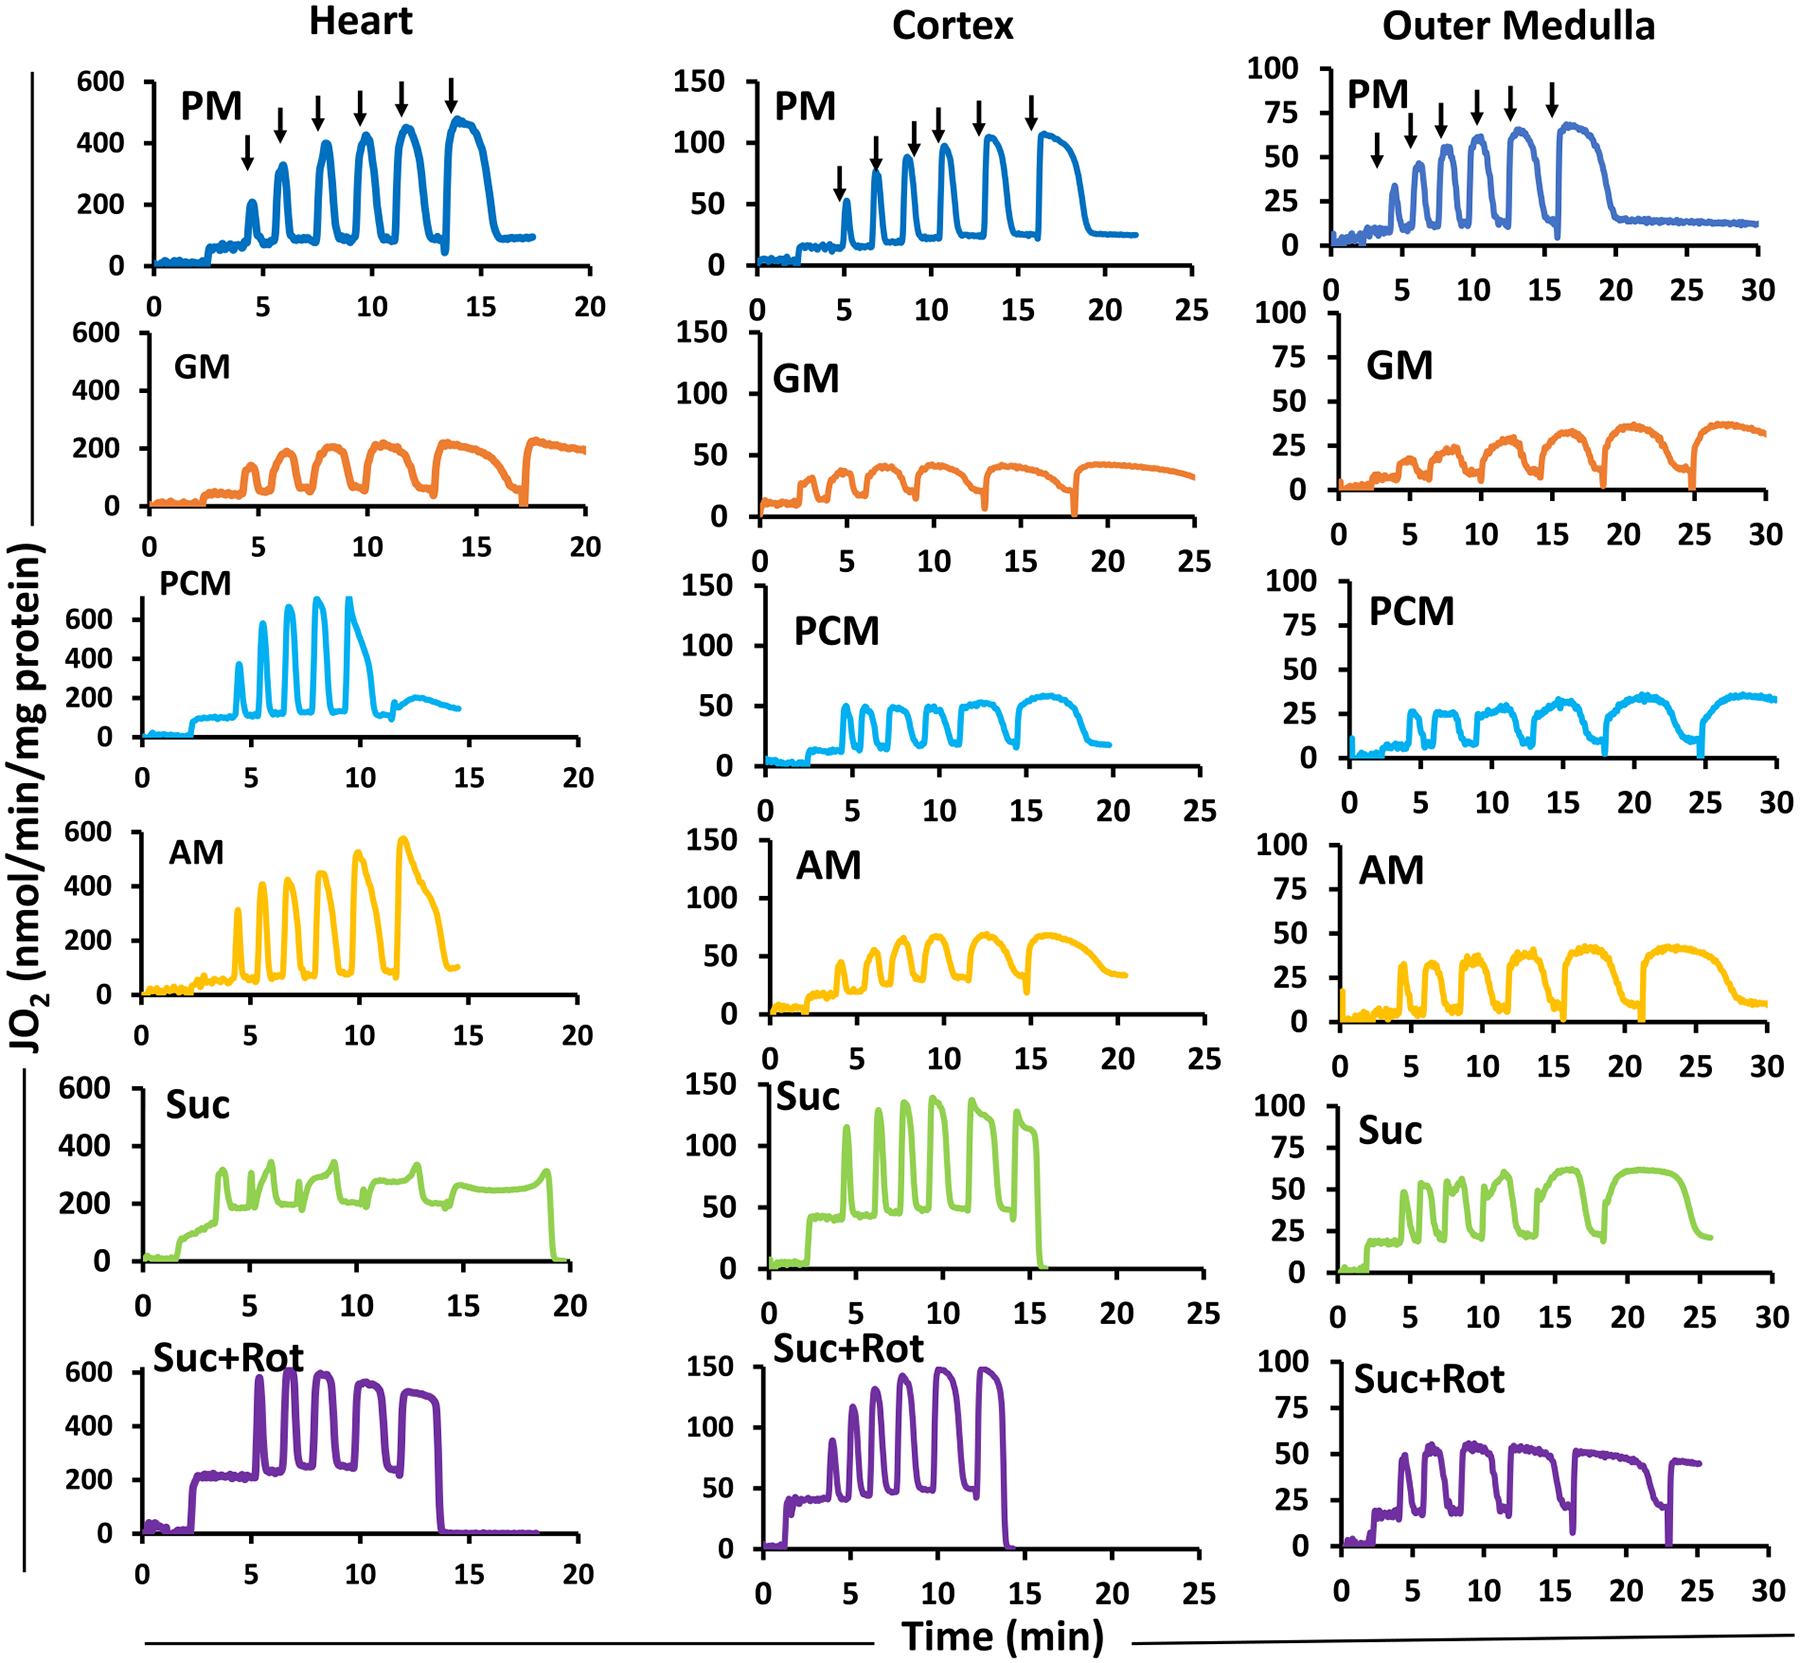
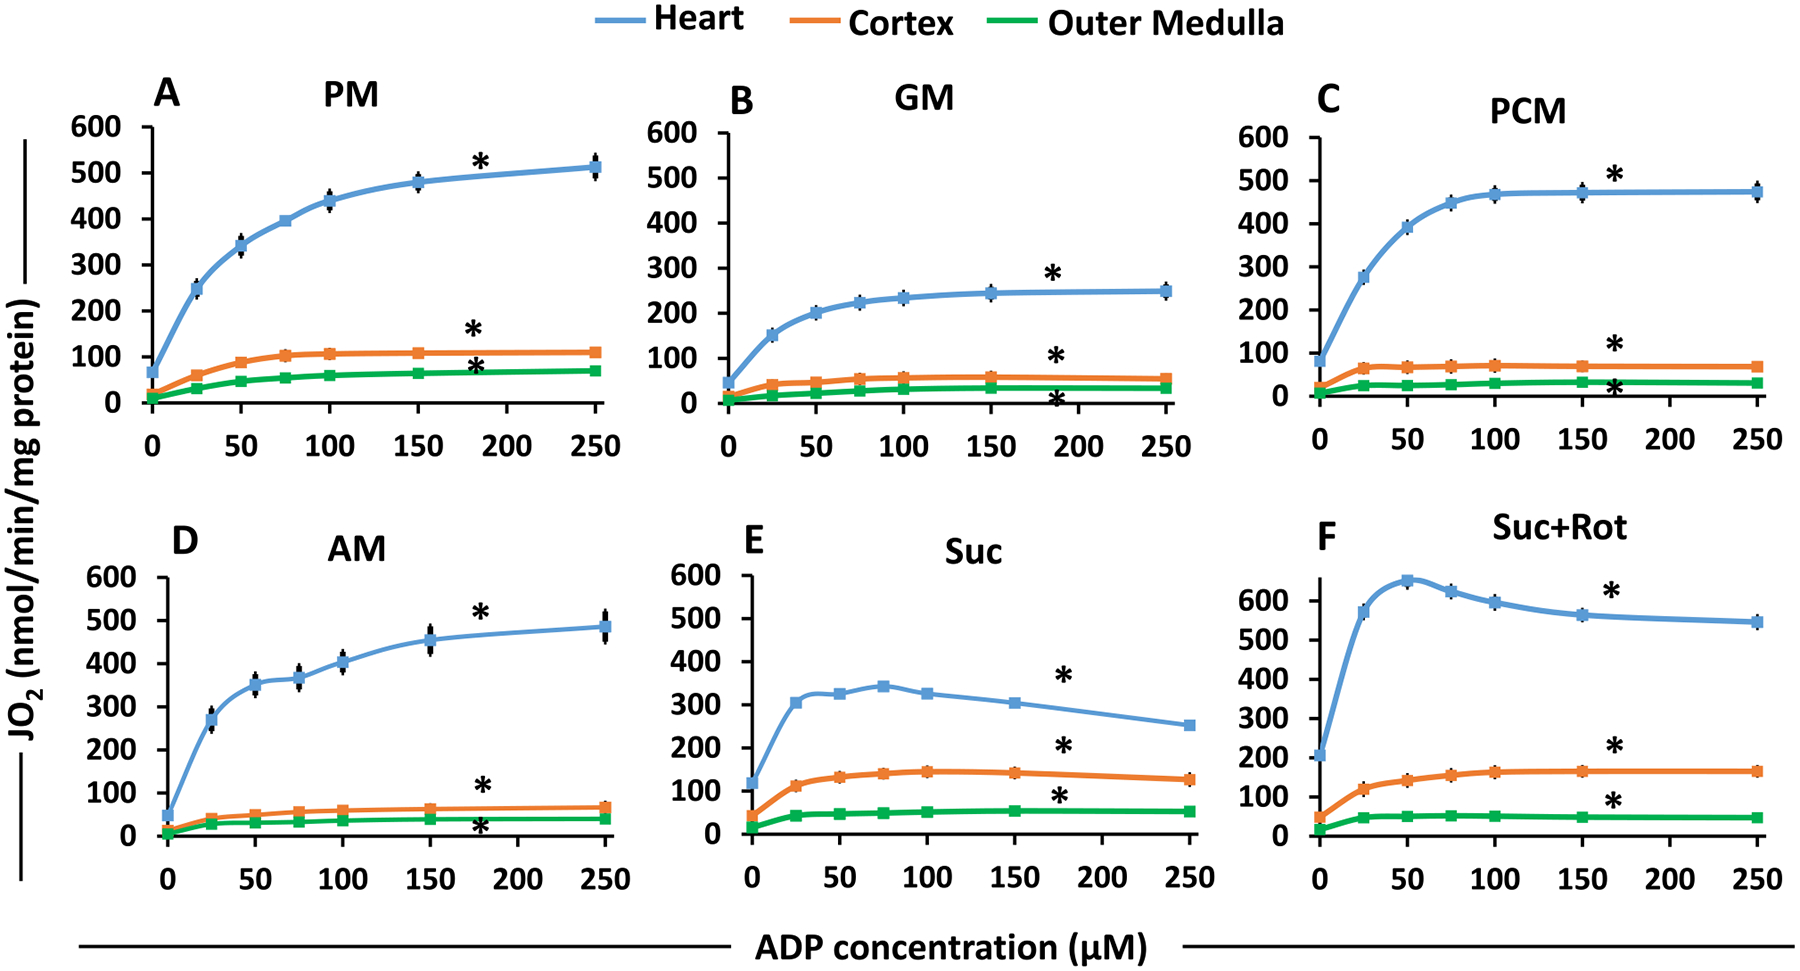
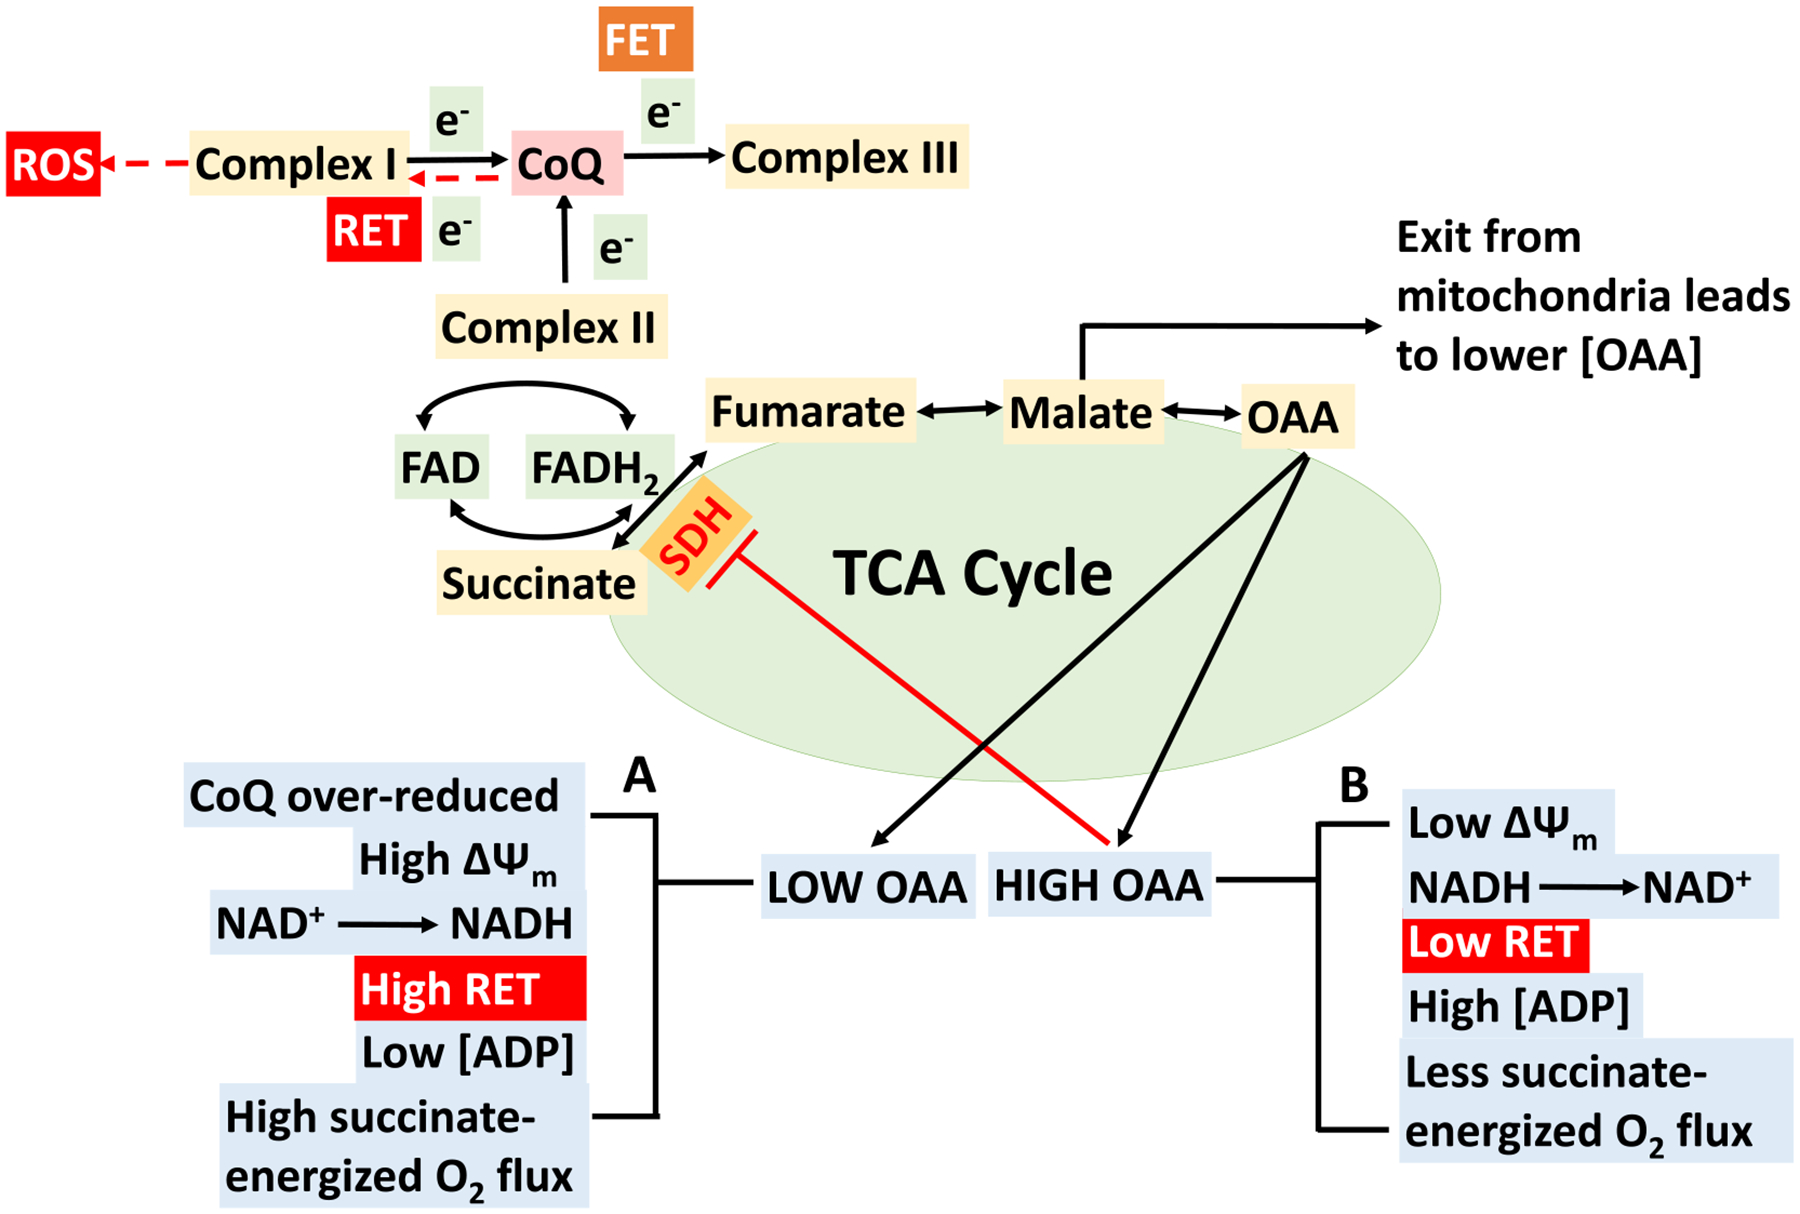
The kinetics and efficiency of mitochondrial oxidative phosphorylation (OxPhos) can depend on the choice of respiratory substrates. Furthermore, potential differences in this substrate dependency among different tissues are not well-understood. Here, we determined the effects of different substrates on the kinetics and efficiency of OxPhos in isolated mitochondria from the heart and kidney cortex and outer medulla (OM) of Sprague-Dawley rats. The substrates were pyruvate+malate, glutamate+malate, palmitoyl-carnitine+malate, alpha-ketoglutarate+malate, and succinate±rotenone at saturating concentrations. The kinetics of OxPhos were interrogated by measuring mitochondrial bioenergetics under different ADP perturbations. Results show that the kinetics and efficiency of OxPhos are highly dependent on the substrates used, and this dependency is distinctly different between heart and kidney. Heart mitochondria showed higher respiratory rates and OxPhos efficiencies for all substrates in comparison to kidney mitochondria. Cortex mitochondria respiratory rates were higher than OM mitochondria, but OM mitochondria OxPhos efficiencies were higher than cortex mitochondria. State 3 respiration was low in heart mitochondria with succinate but increased significantly in the presence of rotenone, unlike kidney mitochondria. Similar differences were observed in mitochondrial membrane potential. Differences in H2O2 emission in the presence of succinate±rotenone were observed in heart mitochondria and to a lesser extent in OM mitochondria, but not in cortex mitochondria. Bioenergetics and H2O2 emission data with succinate±rotenone indicate that oxaloacetate accumulation and reverse electron transfer may play a more prominent regulatory role in heart mitochondria than kidney mitochondria. These studies provide novel quantitative data demonstrating that the choice of respiratory substrates affects mitochondrial responses in a tissue-specific manner.

Keywords: Membrane potential; Mitochondrial bioenergetics; Oxidative phosphorylation; ROS production; Respiration; Reverse electron transport; Substrate metabolism.


Conflict of interest statement

Declaration of competing interest

The authors declare that they have no known competing financial interests or personal relationships that could have appeared to influence the work reported in this paper.

Figures

Fig. 1.
Fig. 1.
Timeline experimental protocols for isolated mitochondrial bioenergetics studies from the heart and kidney cortex and outer medulla (OM) of Sprague-Drawly (SD) rats. (A) Protocol for measuring time-courses of mitochondrial respiration and membrane potential under different substrates with the addition of a fixed ADP concentration. At time (t) = 0 min, mitochondria (0.1 mg protein/ml for heart and 0.2 mg protein/ml for cortex and OM) were added to the respiration buffer. Various substrate combinations (pyruvate+malate (PM), glutamate+malate (GM), palmitoyl-carnitine+malate (PCM), alpha-ketoglutarate+malate (AM), and succinate±rotenone (Suc ± Rot)) were added at t = 2 min to energize the mitochondria and reach state 2. This was followed by addition of a fixed concentration of ADP (200 μM for heart and 100 μM for cortex and OM) at t = 4 min for transitioning through state 3. Once all the ADP was consumed and respiratory state reached state 4, the uncoupler FCCP was added to attain state 5. (B) Protocol for measuring time-courses of mitochondrial respiration under different substrates with the sequential addition of incremental ADP concentrations. At t = 0 min, mitochondria (0.05 mg protein/ml for heart and 0.2 mg protein/ml for cortex and OM) were added to the respiration buffer. Above mentioned substrate combinations were added at t = 2 min to energize the mitochondria and reach state 2. This was followed by the sequential addition of incremental ADP concentrations starting with 25 μM at t = 4 min. Once all the ADP was consumed and respiratory state reached state 4, a higher concentration of ADP was added. Incremental concentrations of ADP (25, 50, 75, 100, 150, and 250 μM) was sequentially added until maximum respiration was observed.
Fig. 2.
Fig. 2.
Characterization of the functional markers of isolated mitochondria. (A) Tissue-specific comparisons of the maximal respiratory control ratio (RCR; state 3/state 2 respiration) for isolated mitochondria from the heart, cortex, and OM with the PM substrate. (B) Tissue-specific comparisons of the citrate synthase (CS) specific activity (U/mg protein) in isolated mitochondria from the heart, cortex and OM. Data are shown as average over n = 6–9 independent biological replicates ± S.E. for each tissue. The symbol ‘*’ shows the statistical significance (p < 0.05) based on one-way ANOVA with repeated measures. Figures were generated using GraphPad Prism 9 software.
Fig. 3.
Fig. 3.
Representative time-courses of isolated mitochondrial respiration for the heart, cortex, and OM transiting from state 1 to state 5 respiration under different substrates. The timeline experimental protocol is as described in Fig. 1A. The respiratory rates (O2 consumption rates; JO2) are expressed as nmol/min/mg mitochondrial protein. The transitions from state 1 to state 5 respiration were monitored by first adding isolated mitochondria (0.1 mg protein/ml for heart and 0.2 mg protein/ml for cortex and OM) to the respiration buffer at t = 0 min leading to state 1. This was followed by addition of different substrate combinations (PM, GM, PCM, AM, or Suc ± Rot) at t = 2 min leading to state 2. This was followed by addition of ADP (200 μM for heart and 100 μM for cortex and OM) at t = 4 min which initiated state 3 respiration proceeding to state 4 after the phosphorylation of the added ADP to ATP. Once all the ADP was consumed, the uncoupler FCCP was added to attain state 5. The rows are for different tissues and the columns are for different substrates. PM: pyruvate+malate, GM: glutamate+malate, PCM: palmitoyl-carnitine+malate, AM: alpha-ketoglutarate+malate, and Suc ± Rot: succinate±rotenone.
Fig. 4.
Fig. 4.
Substrate- and tissue-specific comparisons of isolated mitochondrial respiratory markers for the heart, cortex, and OM with different substrates. Shown are the respiratory rates at state 2 (A), state 3 (B), state 4 (C), and state 5 (D); state 3 duration (E); and P/O ratio (F) for the heart, cortex, and OM under substrates combinations of PM, GM, PCM, AM, and Suc ± Rot. These data are derived from the dynamic data shown in Fig. 3. Data are shown as average over n = 4–6 independent replicates ± S.E. for each substrate and tissue. The symbol ‘*’ shows the statistical significance (p < 0.05) based on one-way ANOVA with repeated measures. Figures were generated using GraphPad Prism 9 software.
Fig. 5.
Fig. 5.
Substrate- and tissue-specific comparisons of the time-courses of isolated mitochondrial membrane potential (ΔΨm in mV; calibrated) for the heart, cortex, and OM transitioning from state 1 to state 5 respiration under different substrates. The timeline experimental protocol is as shown in Fig. 1A. The substrate combinations used are PM (A), GM (B), PCM (C), AM (D), Suc (E), and Suc + Rot (F). The ΔΨm in mV is calibrated from the R123 fluorescent intensity from Supplement Fig. S3. Black arrows show the times (sec) of mitochondria (0.1 mg protein/ml for heart and 0.2 mg protein/ml for cortex and OM), substrates, ADP (200 μM for heart and 100 μM for cortex and OM), and FCCP additions to the PTI spectrofluorometer cuvette in that order. The symbol ‘*’ shows the statistical significance (p < 0.05) of peak state 3 ΔΨm based on one-way ANOVA with repeated measures.
Fig. 6.
Fig. 6.
Comparison of the time-courses of isolated mitochondrial respiration (A–C) and corresponding membrane potential (ΔΨm in mV) (D–F) transitioning from state 1 to state 5 respiration in the presence of the Suc ± Rot for the heart, cortex, and OM. Black arrows show the times of mitochondria, substrate, ADP, and FCCP additions in this order. The symbol ‘*’ shows the statistical significance (p < 0.05) of peak state 3 levels based on one-way ANOVA with repeated measures.
Fig. 7.
Fig. 7.
Tissue-specific mitochondrial H2O2 emission in the presence of Suc ± Rot following the timeline protocol of Fig. 1A. (A–C) Comparison of the time-courses of isolated mitochondrial H2O2 emission transitioning from state 1 to state 5 respiration for heart, cortex and OM. Black arrows show the times of mitochondria, substrate, ADP, and FCCP additions to the PTI spectrofluorometer cuvette in this order. (D–F) Comparison of isolated mitochondrial H2O2 emission rates under different respiration states (state 1 to state 5) for heart, cortex and OM. (G–J) Tissue-specific isolated mitochondrial H2O2 emission at different respiratory states (state 2 to stae 5) for heart, cortex and OM. Suc ± Rot: succinate±rotenone. Data are shown as average over n = 5 independent replicates ± S.E. for each substrate and tissue. The symbol ‘*’ shows the statistical significance (p < 0.05) on one-way ANOVA with repeated measures. Figures were generated using GraphPad Prism 9 software.
Fig. 8.
Fig. 8.
Representative time-courses of isolated mitochondrial respiration for the heart, cortex, and OM during sequential additions of incremental ADP concentrations in the presence of different substrates. The timeline experimental protocol is as described in Fig. 1B. The respiratory rates (O2 consumption rates; JO2) are expressed as nmol/min/mg mitochondrial protein. Isolated mitochondria (0.05 mg protein/ml for heart and 0.2 mg protein/ml for cortex and OM) were suspended in the respiration buffer (2 ml) at time t = 0 min and was energized by different substrate combinations (PM, GM, PCM, AM, or Suc ± Rot) at time t = 2 min. This was followed by sequential additions of incremental ADP concentrations until maximal respiration is reached. Black arrows indicate the times of ADP additions (25, 50, 75, 100, 150, and 250 μM) to the energized mitochondria in the Oroboros chamber. The rows are for different tissues and the columns are for different substrates. PM: pyruvate+malate, GM: glutamate+malate, PCM: palmitoyl-carnitine+malate, AM: alpha-ketoglutarate+malate, and Suc ± Rot: succinate±rotenone.
Fig. 9.
Fig. 9.
Substrate- and tissue-specific comparisons of isolated mitochondrial state 3 respiration for the heart, cortex and OM as functions of ADP concentrations for different substrates. These data are derived from the dynamic OCR (JO2) data shown in Fig. 7 with sequential additions of incremental ADP concentrations with different substrates. The substrate combinations used are PM (A), GM (B), PCM (C), AM (D), Suc (E), and Suc + Rot (F). Each plot shows the comparisons of state 3 OCR among the heart, cortex and OM mitochondria. Data are shown as average of n = 4–6 independent replicates with ± SE for each substrate and tissue. The symbol ‘*’ shows the statistical significance (p < 0.05) based on one-way ANOVA with repeated measures.
Fig. 10.
Fig. 10.
Schematics depicting postulated mechanisms behind the oxaloacetic acid (OAA) driven regulation of succinate-energized isolated cardiac mitochondrial bioenergetics. There are two scenarios: (A) low OAA and (B) high OAA. (A) Low OAA (due to minimal conversion of malate to OAA) does not hamper enzyme succinate dehydrogenase (SDH) catalytic activity to convert succinate into fumarate and complex II gets enough electrons to achieve sufficient succinate-energized mitochondrial respiration (O2 flux). The extent of O2 flux is regulated by the overall effects of mitochondrial membrane potential (ΔΨm) and reduction of NAD+. In this case, CoQ becomes over-reduced and higher ΔΨm favors reverse electron transfer (RET) from ubiquinol to complex I. Electron may leak at either IF/IQ site within complex I and generates RET-induced superoxide. Complex I (IQ site) inhibition by rotenone (Rot) in our experiment during RET prevents CoQ from transferring electrons back to complex I and thus reduces ROS production. RET prevents complex V making ATP, hence less ATP production at this stage. (B) Higher OAA accumulation occurs with addition of higher ADP concentration (200 μM for heart mitochondria in our study), leading to lower succinate-driven O2 flux. Higher concentration of ADP leads to drop in ΔΨm, which favors forward electron transfer (FET) enabling NADH providing electrons at complex I which abolishes RET. OAA accumulation is sufficient enough to inhibit SDH and thereby succinate-driven mitochondrial respiration.

Similar articles

Cited by

References

    1. Kunz WS, Different metabolic properties of mitochondrial oxidative phosphorylation in different cell types–important implications for mitochondrial cytopathies, Exp. Physiol 88 (1) (2003) 149–154. - PubMed
    1. Johnson DT, et al., Functional consequences of mitochondrial proteome heterogeneity, Am. J. Physiol. Cell Physiol 292 (2) (2007) C698–C707. - PubMed
    1. Herbers E, et al., Tissue specific differences in mitochondrial DNA maintenance and expression, Mitochondrion 44 (2019) 85–92. - PubMed
    1. Rossignol R, et al., Tissue variation in the control of oxidative phosphorylation: implication for mitochondrial diseases, Biochem. J 347 (Pt 1) (2000) 45–53. - PMC - PubMed
    1. Pohjoismäki JL, Goffart S, The role of mitochondria in cardiac development and protection, Free Radic. Biol. Med 106 (2017) 345–354. - PubMed

LinkOut - more resources