Observational Study
. 2022 Jun;79(6):807-819.e1.
doi: 10.1053/j.ajkd.2021.10.004. Epub 2021 Dec 3.

Quantification of Glomerular Structural Lesions: Associations With Clinical Outcomes and Transcriptomic Profiles in Nephrotic Syndrome

Collaborators, Affiliations
Observational Study

Quantification of Glomerular Structural Lesions: Associations With Clinical Outcomes and Transcriptomic Profiles in Nephrotic Syndrome

Jeffrey B Hodgin et al. Am J Kidney Dis. 2022 Jun.

Abstract

Rationale & objective: The current classification system for focal segmental glomerulosclerosis (FSGS) and minimal change disease (MCD) does not fully capture the complex structural changes in kidney biopsies nor the clinical and molecular heterogeneity of these diseases.

Study design: Prospective observational cohort study.

Setting & participants: 221 MCD and FSGS patients enrolled in the Nephrotic Syndrome Study Network (NEPTUNE).

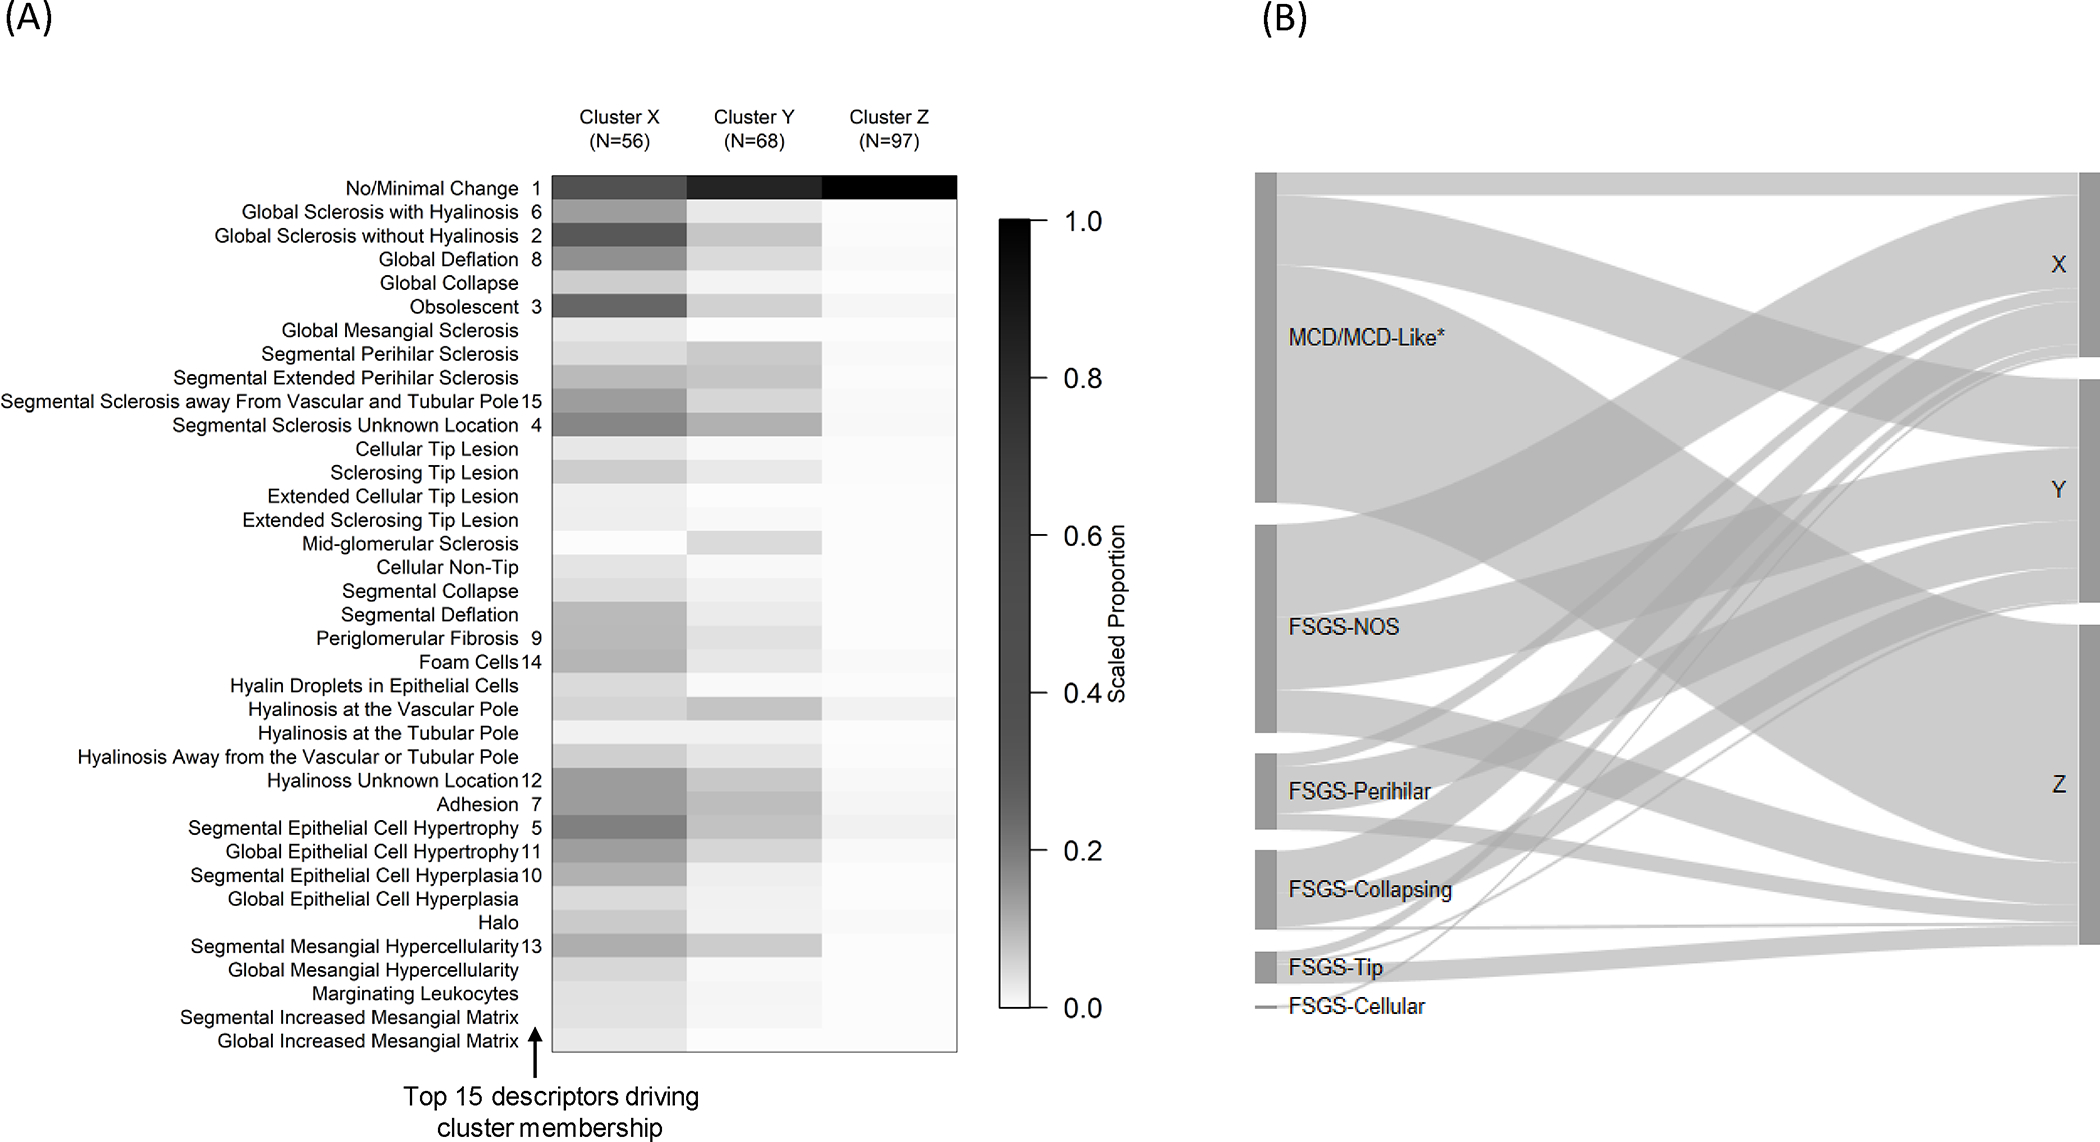
Exposure: The NEPTUNE Digital Pathology Scoring System (NDPSS) was applied to generate scores for 37 glomerular descriptors.

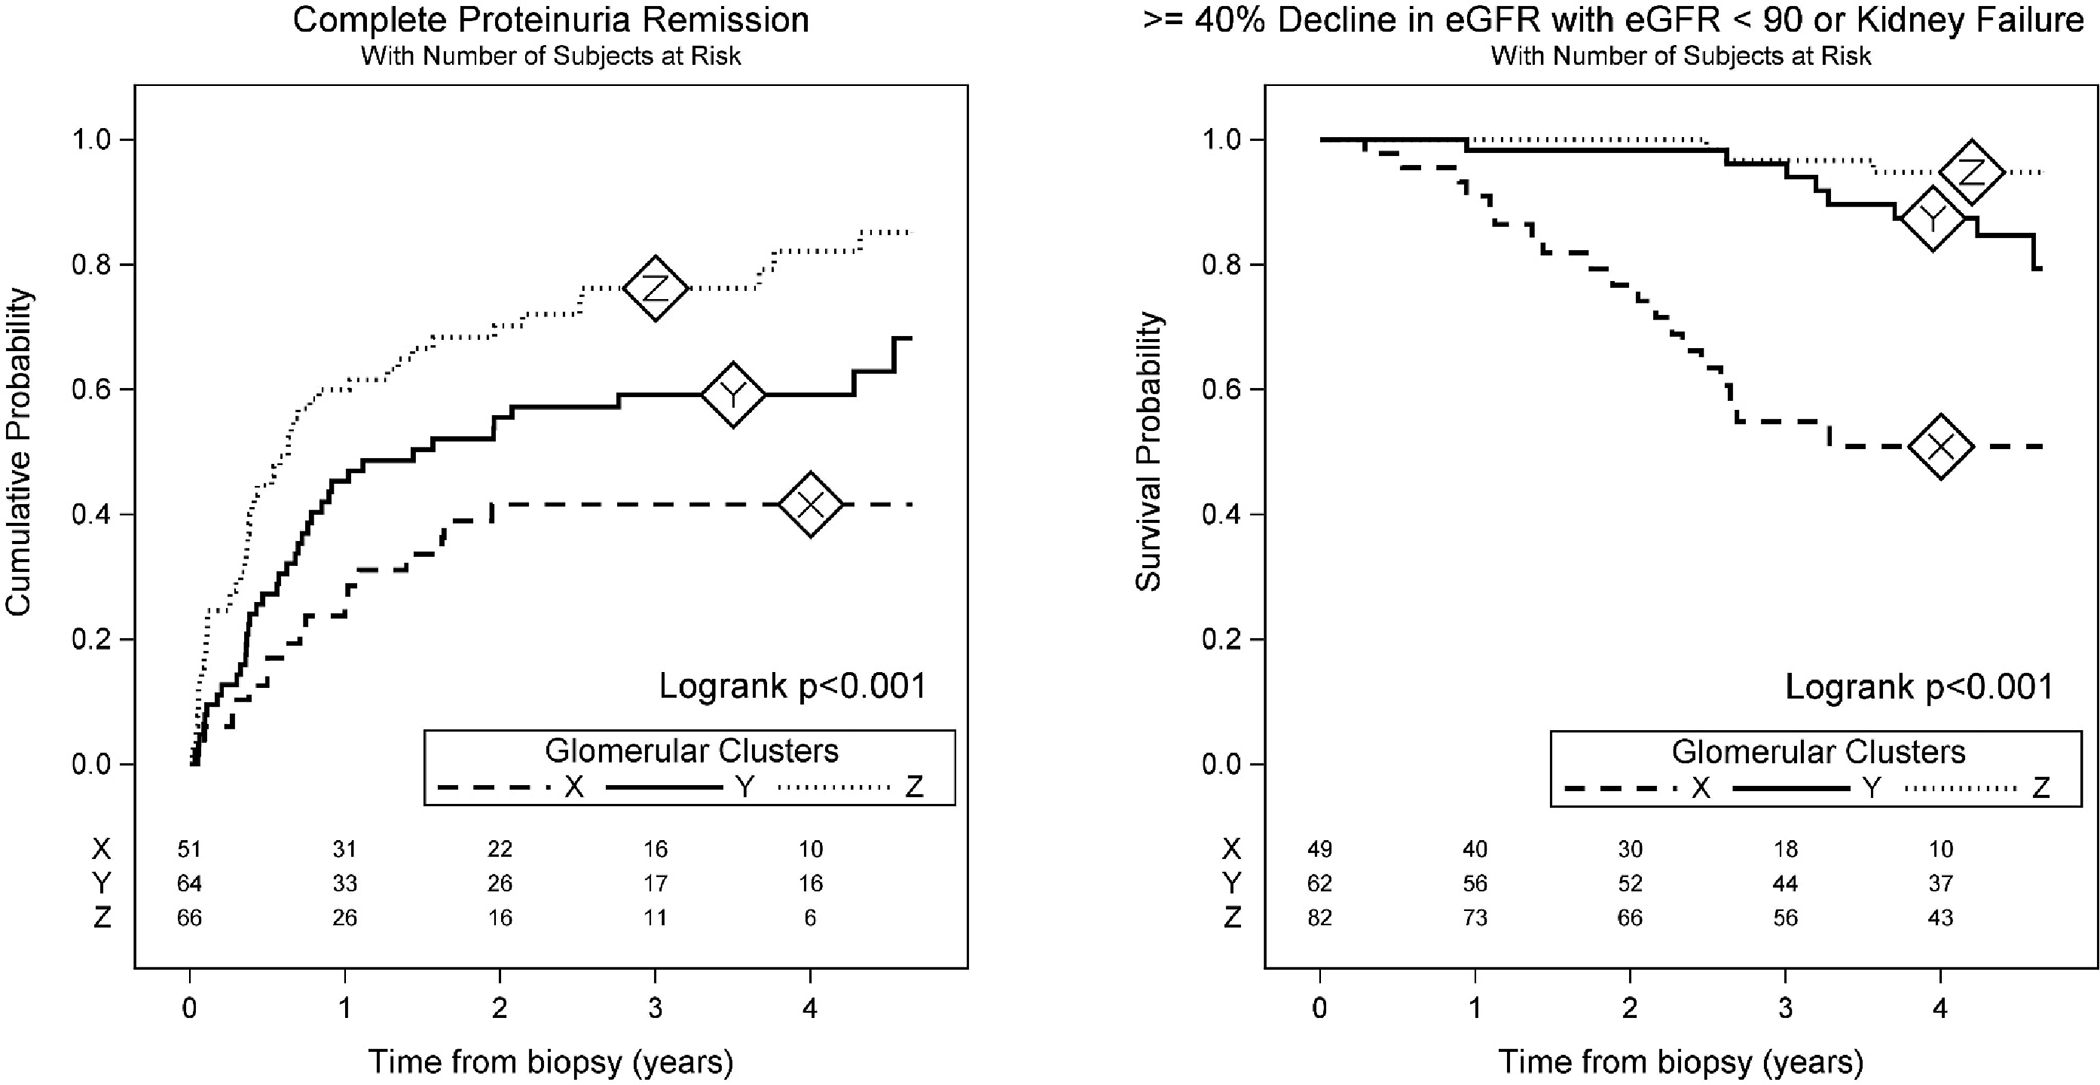
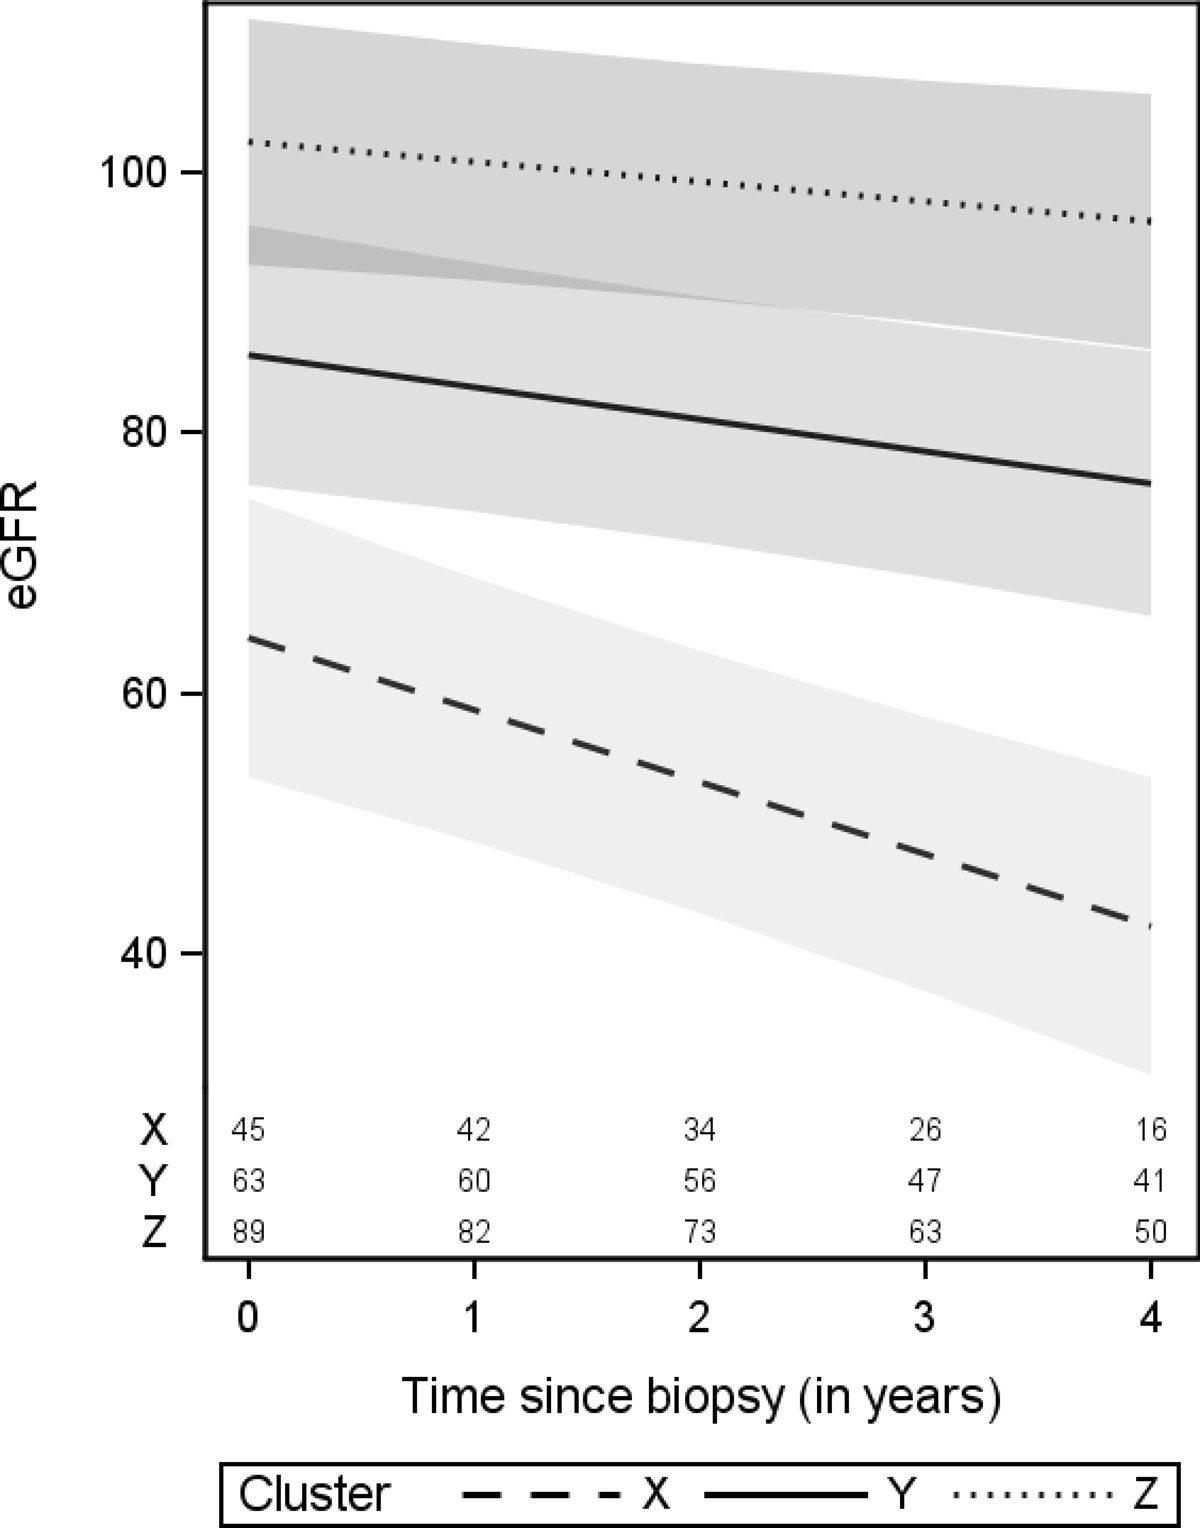
Outcome: Time from biopsy to complete proteinuria remission, time from biopsy to kidney disease progression (40% estimated glomerular filtration rate [eGFR] decline or kidney failure), and eGFR over time.

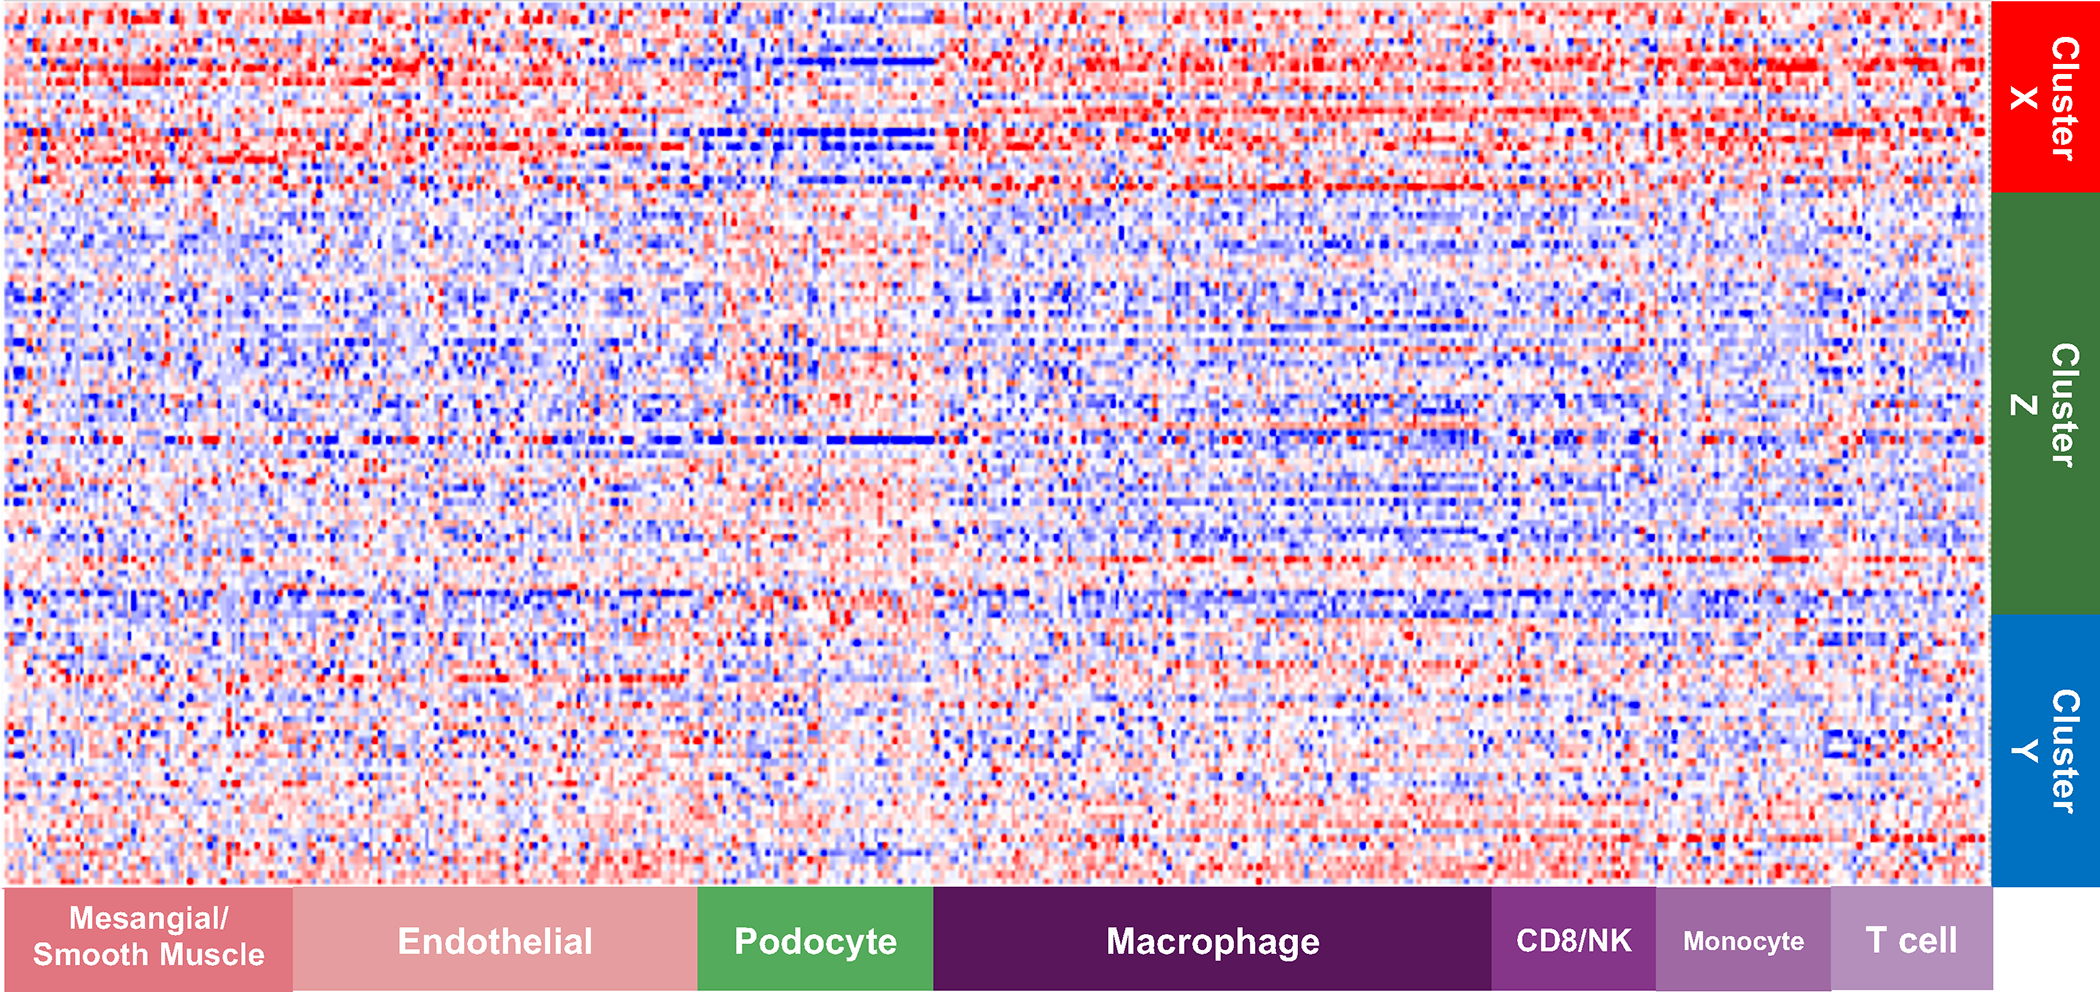
Analytical approach: Cluster analysis was used to group patients with similar morphologic characteristics. Glomerular descriptors and patient clusters were assessed for associations with outcomes using adjusted Cox models and linear mixed models. Messenger RNA from glomerular tissue was used to assess differentially expressed genes between clusters and identify genes associated with individual descriptors driving cluster membership.

Results: Three clusters were identified: X (n = 56), Y (n = 68), and Z (n = 97). Clusters Y and Z had higher probabilities of proteinuria remission (HRs of 1.95 [95% CI, 0.99-3.85] and 3.29 [95% CI, 1.52-7.13], respectively), lower hazards of disease progression (HRs of 0.22 [95% CI, 0.08-0.57] and 0.11 [95% CI, 0.03-0.45], respectively), and lower loss of eGFR over time compared with X. Cluster X had 1,920 genes that were differentially expressed compared with Y+Z; these reflected activation of pathways of immune response and inflammation. Six descriptors driving the clusters individually correlated with clinical outcomes and gene expression.

Limitations: Low prevalence of some descriptors and biopsy at a single time point.

Conclusions: The NDPSS allows for categorization of FSGS/MCD patients into clinically and biologically relevant subgroups, and uncovers histologic parameters associated with clinical outcomes and molecular signatures not included in current classification systems.

Keywords: Clinical outcomes; disease classification; focal segmental glomerulosclerosis (FSGS); gene expression; glomerular disease; glomerular structure; kidney biopsy; minimal change disease (MCD); molecular analysis; morphologic features; nephrotic syndrome; precision medicine; proteinuria; renal pathology; transcriptomics.


Figures

Figure 1:
Figure 1:. Hierarchical clustering of 221 NEPTUNE participants with FSGS and MCD based on 39 glomerular descriptors.
The heat map (A) shows the mean value of each descriptor by cluster after scaling each descriptor to 0–1 based on the observed range (i.e. the descriptor’s observed minimum is scaled to 0 and maximum to 1). The darker cells therefore represent greater percentages of glomeruli with each descriptor relative to others in the sample. The numbers 1–15 to the right side of descriptor labels indicate variable importance in driving cluster membership, obtained from variable entry order in a penalized multinomial regression model. The Sankey diagram (B) shows relationships between conventional classification categories (left) and cluster membership (right). The width of each ribbon-shaped band is proportional to the number of patients in that band. *MCD refers to cases with ≥75% effacement with no global sclerosis or global sclerosis expected for age, and MCD-Like refers to cases with <75% effacement with or without presence of global sclerosis exceeding that expected for age or ≥75% effacement with global sclerosis exceeding that expected for age.
Figure 2:
Figure 2:. Kaplan-Meier curves for each of the three clusters showing cumulative probability of complete proteinuria remission (left) and the survival probability of ≥40% decline in eGFR with eGFR <90 or kidney failure (right) by clusters.
Cluster X had the lowest (worst) probability of proteinuria remission and highest (worst) probability of disease progression, while Cluster Z had the highest proteinuria remission probabilities and Clusters Y and Z had similar disease progression probabilities.
Figure 3:
Figure 3:. Estimated eGFR trajectories by cluster from longitudinal eGFR models.
eGFR trajectories in this figure were estimated from the model adjusted for demographics and clinical characteristics. Cluster-specific averages were used for eGFR at biopsy (57, 79, and 109 mL/min/1.73m2 for Clusters X, Y, and Z, respectively). Confidence bands are based on 95% pointwise confidence intervals. Numbers at the bottom of the graph represent the number of patients available for analysis at each time point.
Figure 4:
Figure 4:. Cell-type specific gene expression across clusters.
Cell-type selective gene expression profiles were overlaid onto clustered gene expression data. The expression data were row normalized as Z-scores where blue indicates low expression and red indicates high expression. The emerging pattern indicates that cell-selective gene profiles show evidence of differential gene expression across pathology defined clusters. For example, podocyte-selective gene expression is reduced in Cluster X compared to Clusters Y and Z, whereas macrophage-selective gene expression is increased. This observation strengthens confidence that descriptor clustering is identifying underlying biological mechanism.

Comment in

References

    1. D’Agati VD, Fogo AB, Bruijn JA, Jennette JC. Pathologic classification of focal segmental glomerulosclerosis: a working proposal. Am J Kidney Dis. 2004:368–82. vol. 2. - PubMed
    1. Barisoni L, Hodgin JB. Digital pathology in nephrology clinical trials, research, and pathology practice. Curr Opin Nephrol Hypertens. 11 2017;26(6):450–459. doi:10.1097/MNH.0000000000000360 - DOI - PMC - PubMed
    1. Barisoni L, Lafata KJ, Hewitt SM, Madabhushi A, Balis UGJ. Digital pathology and computational image analysis in nephropathology. Nat Rev Nephrol. Nov 2020;16(11):669–685. doi:10.1038/s41581-020-0321-6 - DOI - PMC - PubMed
    1. Barisoni L, Nast CC, Jennette JC, et al. Digital pathology evaluation in the multicenter Nephrotic Syndrome Study Network (NEPTUNE). Clin J Am Soc Nephrol. Aug 2013;8(8):1449–59. doi:10.2215/cjn.08370812 - DOI - PMC - PubMed
    1. Gadegbeku CA, Gipson DS, Holzman LB, et al. Design of the Nephrotic Syndrome Study Network (NEPTUNE) to evaluate primary glomerular nephropathy by a multidisciplinary approach. Kidney Int. Apr 2013;83(4):749–56. doi:10.1038/ki.2012.428 - DOI - PMC - PubMed

Publication types