

Make Interactive Complex Heatmaps in R
- PMID: 34864868
- PMCID: PMC8826183
- DOI: 10.1093/bioinformatics/btab806
Make Interactive Complex Heatmaps in R
Abstract
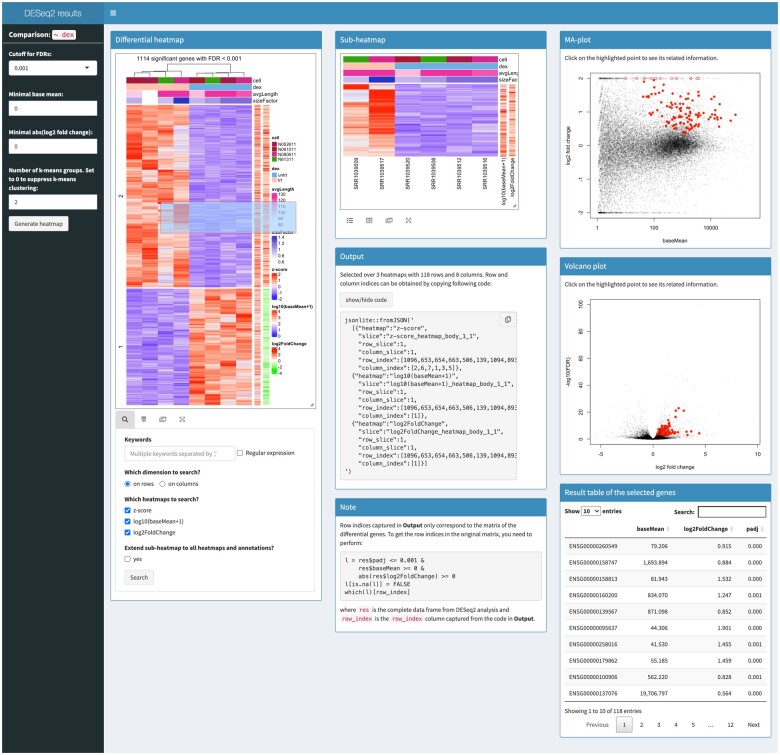
Summary: Heatmap is a powerful visualization method on two-dimensional data to reveal patterns shared by subsets of rows and columns. In this work, we introduce a new R package InteractiveComplexHeatmap that brings interactivity to the widely used ComplexHeatmap package. InteractiveComplexHeatmap is designed with an easy-to-use interface where static complex heatmaps can be directly exported to an interactive Shiny web application only with one additional line of code. InteractiveComplexHeatmap also provides flexible functionalities for integrating interactive heatmap widgets to build more complex and customized Shiny web applications.
Availability and implementation: The InteractiveComplexHeatmap package and documentations are freely available from the Bioconductor project: https://bioconductor.org/packages/InteractiveComplexHeatmap/. A complete and printer-friendly version of the documentation can also be found in Supplementary File S1.
Supplementary information: Supplementary data are available at Bioinformatics online.
© The Author(s) 2021. Published by Oxford University Press.
Figures
References
-
- Gu Z. et al. (2016) Complex heatmaps reveal patterns and correlations in multidimensional genomic data. Bioinformatics, 32, 2847–2849. - PubMed
