. 2022 Apr 7;139(14):2198-2211.
doi: 10.1182/blood.2021013442.

Single-cell multiomics reveals increased plasticity, resistant populations, and stem-cell-like blasts in KMT2A-rearranged leukemia

Affiliations

Single-cell multiomics reveals increased plasticity, resistant populations, and stem-cell-like blasts in KMT2A-rearranged leukemia

Changya Chen et al. Blood. .

Abstract

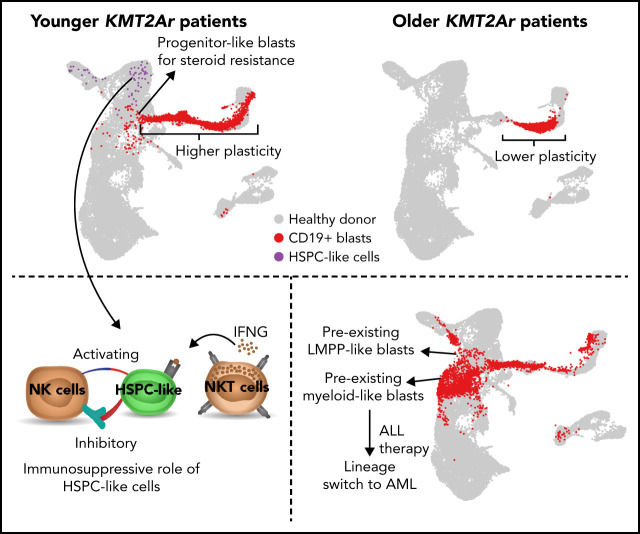
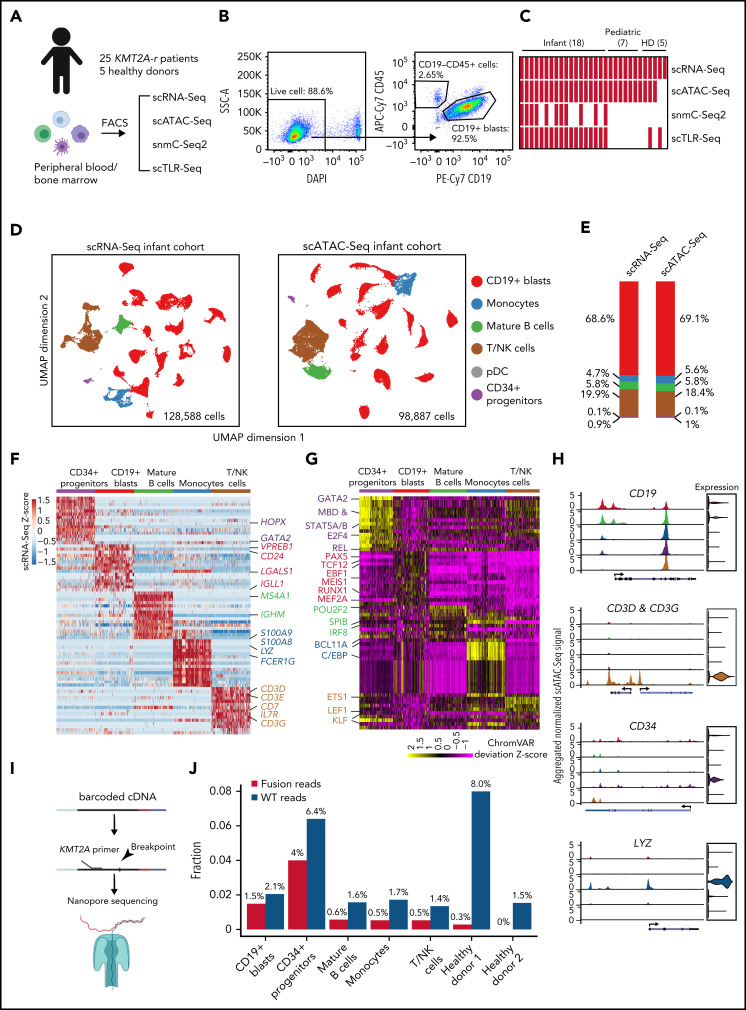
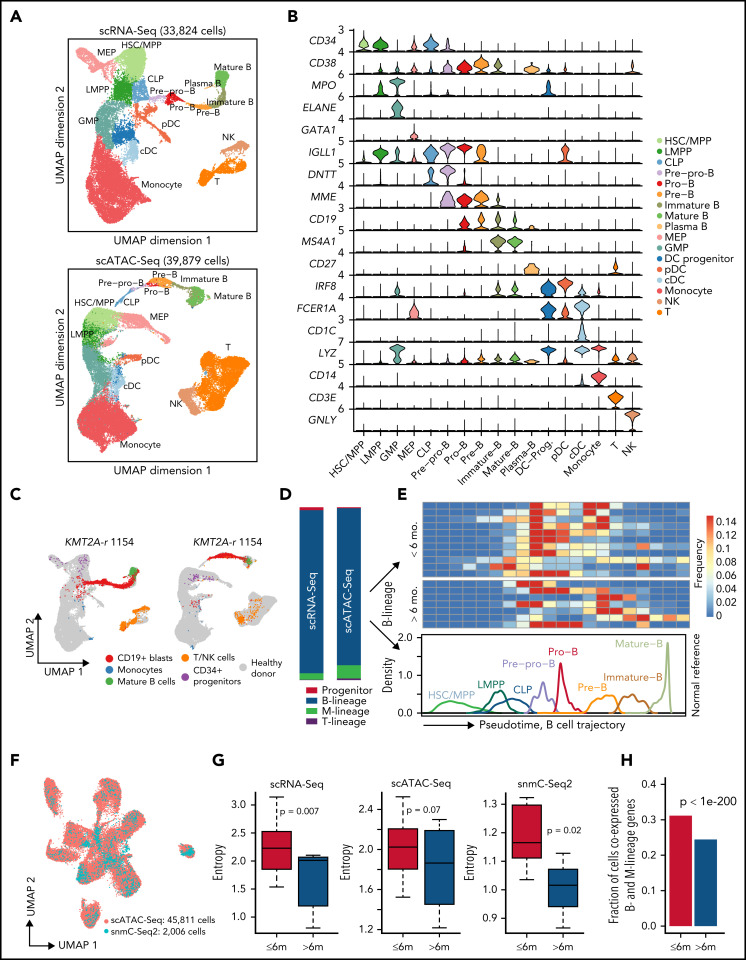
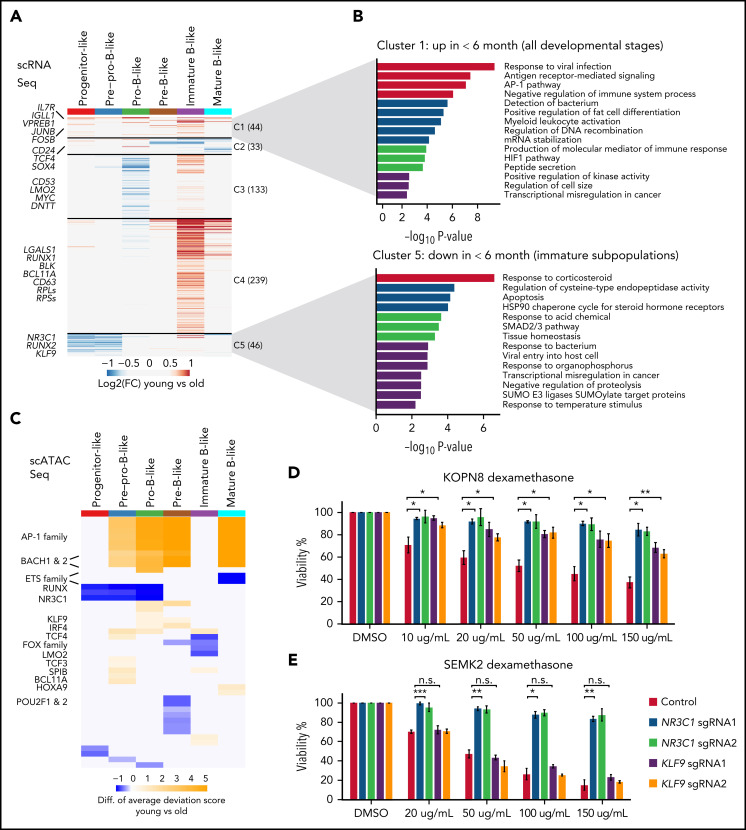
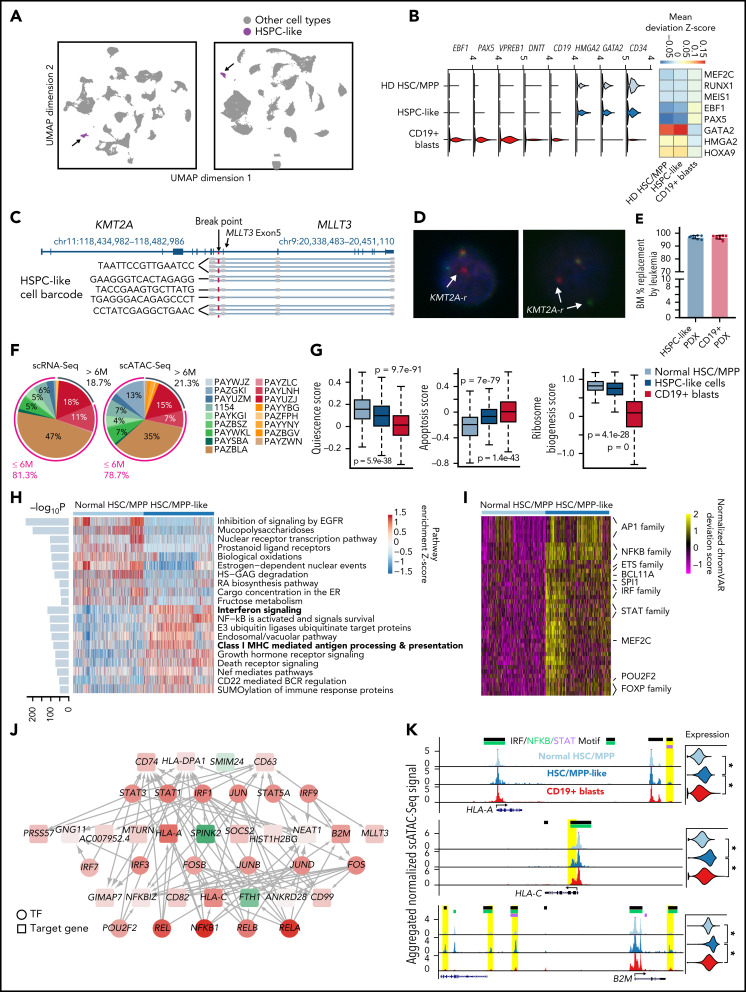
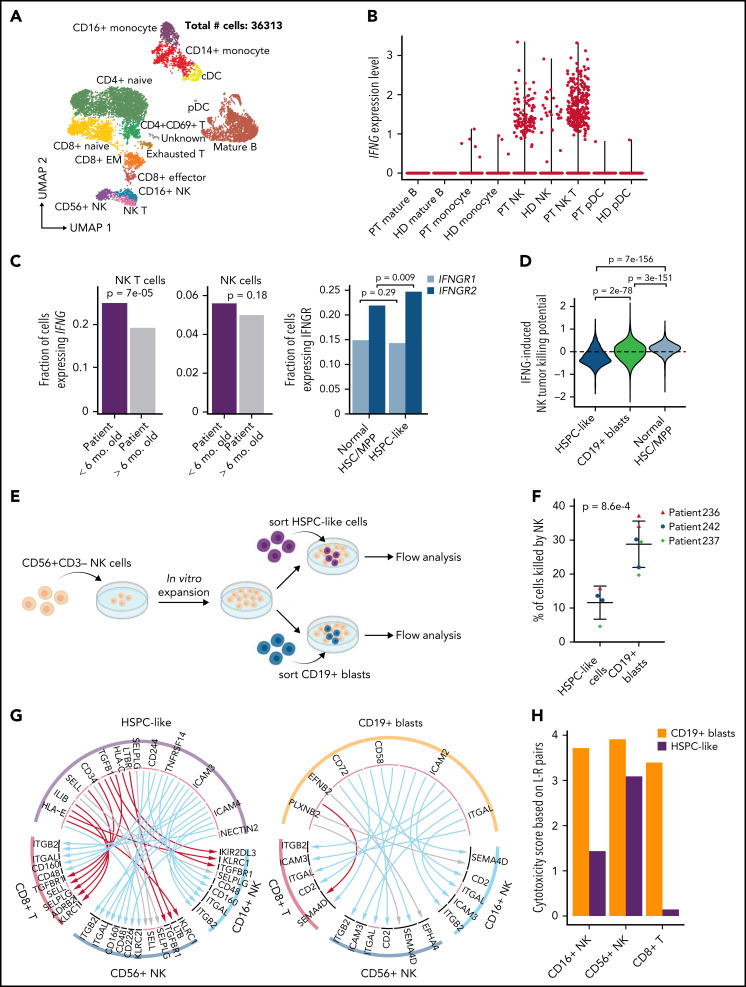
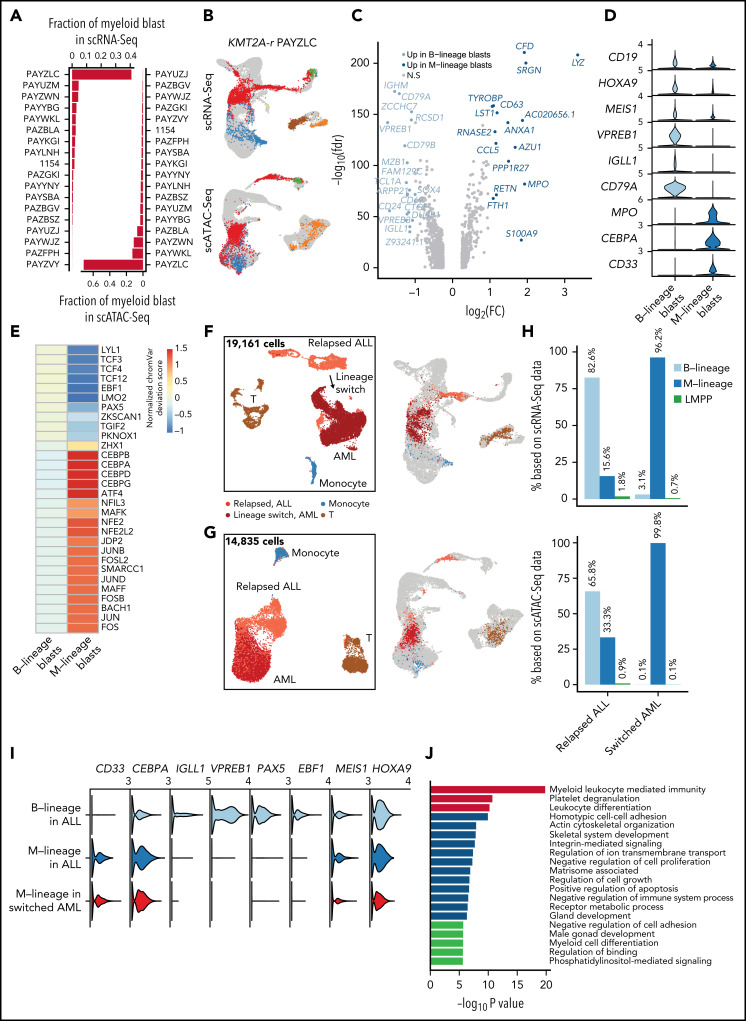
KMT2A-rearranged (KMT2A-r) infant acute lymphoblastic leukemia (ALL) is a devastating malignancy with a dismal outcome, and younger age at diagnosis is associated with increased risk of relapse. To discover age-specific differences and critical drivers that mediate poor outcome in KMT2A-r ALL, we subjected KMT2A-r leukemias and normal hematopoietic cells from patients of different ages to single-cell multiomics analyses. We uncovered the following critical new insights: leukemia cells from patients <6 months have significantly increased lineage plasticity. Steroid response pathways are downregulated in the most immature blasts from younger patients. We identify a hematopoietic stem and progenitor-like (HSPC-like) population in the blood of younger patients that contains leukemic blasts and form an immunosuppressive signaling circuit with cytotoxic lymphocytes. These observations offer a compelling explanation for the ability of leukemias in young patients to evade chemotherapy and immune-mediated control. Our analysis also revealed preexisting lymphomyeloid primed progenitors and myeloid blasts at initial diagnosis of B-ALL. Tracking of leukemic clones in 2 patients whose leukemia underwent a lineage switch documented the evolution of such clones into frank acute myeloid leukemia (AML). These findings provide critical insights into KMT2A-r ALL and have clinical implications for molecularly targeted and immunotherapy approaches. Beyond infant ALL, our study demonstrates the power of single-cell multiomics to detect tumor intrinsic and extrinsic factors affecting rare but critical subpopulations within a malignant population that ultimately determines patient outcome.


Figures

None
Graphical abstract
Figure 1.
Figure 1.
Single-cell multiomics profiling of pediatric KMT2A-r leukemia. (A) Experimental design of multiomics profiling of KMT2A-r leukemia and healthy donor samples. (B) Sorting strategy for capturing blasts and nonmalignant cells from B-ALL patients. (C) Number of assays/samples performed for each single-cell omics protocol. (D) Overall UMAP of all scRNA-Seq cells (left panel) and all scATAC-Seq cells (right panel) of 18 infant ALL samples, colored by assigned cell populations. Total numbers of sequenced cells are indicated. (E) Cell type compositions based on the scRNA-Seq and scATAC-Seq data in panel D. (F) Heatmap of differentially expressed genes for each cell population compared with the rest of populations [abs(Log2[FC]) >0.5 and FDR <0.05]. Values in the heatmap are row-wise Z-scores. Color code for each cell population is the same as in panel D. (G) Heatmap of enriched TFs at ATAC-Seq peaks. Enrichment is represented by the normalized deviation scores (z-score) calculated by chromVAR. (H) Genome browser tracks and gene expression violin plots for representative cell-type-specific marker genes. Left panels, aggregated scATAC-Seq signals for each assigned cell type. Right panels, normalized scRNA-Seq expression values for the corresponding cell type. (I) Schematic of scTLR-Seq for detecting fusion transcripts in single cells. (J) Fraction of cells with KMT2A fusion and wild-type reads for each cell population, including blasts, mature B cells, monocytes, NK/T cells from patients, and hematopoietic cells from healthy donors, defined as the ratio of the number of cells with KMT2A reads vs the total number of sequenced cells of a given population.
Figure 2.
Figure 2.
Projection of KMT2A-r leukemia cells to normal hematopoietic trajectory reveals larger intratumor heterogeneity in younger patients. (A) UMAPs based on scRNA-Seq (top panel) and scATAC-Seq data from healthy pediatric donors (bottom panel). scATAC-Seq includes the dataset generated in this study and previously published datasets. Cell type annotation for scATAC-Seq data were transferred from scRNA-Seq data using Seurat. Total numbers of sequenced cells are indicated on top. (B) Violin plots of marker gene expression used for defining the hematopoietic cell populations. (C) Projection of patient cells onto normal hematopoietic trajectories. Left panel, representative projection of patient 1154 scRNA-Seq data. Right panel, representative projection of patient 1154 scATAC-Seq data. Gray dots, cells from healthy donors; colored dots, patient cells. (D) Composition of CD19+ leukemic blasts in different hematopoietic lineages based on projected scRNA-Seq data (left bar) and scATAC-Seq data (right bar). M-lineage, myeloid lineage. (E) Frequency of B-lineage blasts from 18 infant KMT2A-r patients stratified along the normal hematopoietic trajectory (pseudotime). B-lineage pseudotime from HSC/MPPs to mature B cells is ordered into 20 bins. Upper heatmap shows the frequency of each bin from all 18 infant KMT2A-r patients. Lower line plot shows the frequency of each developmental stage along the pseudotime trajectory using healthy donor data. (F) UMAP shows coembedded snmC-Seq2 and scATAC-Seq data. Total numbers of sequenced cells of each modality are indicated. (G) Blasts from younger patients (<6 months old) show higher developmental heterogeneity based on scRNA-Seq, scATAC-Seq, and snmC-Seq2 data, respectively. Heterogeneity was quantified using Shannon’s entropy. P values are based on Student t test. (H) Fractions of cells aberrantly coexpressing B (VPREB1, IGLL1, CD79A, and CD19) and myeloid (MPO, CEBPA, and CD33) lineage antigens in younger and older infant patients. P value was computed using a one-sided binomial test.
Figure 3.
Figure 3.
Transcriptomic and epigenomic signatures of blasts in younger patients. (A) Heatmap for differentially expressed genes [abs(log2[FC]) >0.5 and FDR <0.05] of blasts arrested at various B-cell developmental stages between younger (<6 months old) and older (>6 months old) patients. DEGs were pooled and clustered by k-means clustering (k = 5) based on their log2FC. Number of genes in each cluster is indicated in the parenthesis. Nonsignificant genes are colored gray. (B) Pathway enrichment analysis results for DEGs in clusters 1 (top panel) and cluster 5 (bottom panel). (C) Heatmap for differential TF motif accessibility of blasts arrested at various B-cell developmental stages between younger and older patients. For each TF in each cell, the motif accessibility at scATAC-Seq peaks was computed as the normalized deviation score using chromVAR. Color in the heatmap indicates the difference in normalized chromVAR deviation scores averaged across all cells in younger vs older patients. TFs with differential accessibility between younger and older patients were identified by Wilcoxon test of the normalized deviation scores between the 2 groups with an FDR cutoff <0.05. Nonsignificant TFs were colored in gray. (D-E) Viability of wild type and NR3C1/KLF9 KO KOPN8 (D) and SEMK2 (E) cell lines after dexamethasone treatment with different doses. Error bar, standard deviation of 2 biological replicates. P values by Student t-test for KO vs control are shown: *P < .05; **P < .01; ***P < .001. n.s., not significant.
Figure 4.
Figure 4.
A leukemia cell containing HSPC-like population exists in younger patients. (A) UMAPs of single-cell data from the PB of 18 infant patients highlighting the hematopoietic stem and progenitor-like population in the PB of the patients (HSPC-like cells, purple). Gray, other cell types. Left panel, UMAP based on scRNA-Seq data, showing 128 588 total cells, 1136 of which are HSPC-like cells. Right panel, UMAP based on scATAC-Seq data, showing 98 887 total cells, 1020 of which are HSPC-like. (B) Gene expression and regulator activity signatures for normal HSPCs, HSPC-like cells, and CD19+ blasts. Left panel, violin plots of marker gene expression in the 3 cell types. Right panel, activity of cell-type-specific transcriptional factors in the 3 cell types. Activity was measured as the mean TF motif chromatin accessibility score in each cell type. (C) Representative result of fusion reads identified in HSPC-like cells from patient 1154 using scTLR-Seq. Fusion reads from multiple HSPC-like blasts (with different cell barcodes) are shown. (D) Representative DNA FISH images of HSPC-like cells. Blue, DAPI; red dots, 5′ of KMT2A gene; green dots, 3′ of KMT2A gene. White arrows indicate KMT2A translocation. (E) Barplot shows leukemia burdens (percentage of hCD45) in the end-of-study BM in 2 groups. Blue, PDX cells from HSPC-like engrafted mice (n = 8); red, PDX cells from CD19+ blasts engraft mice (n = 8). (F) Percentages of total HSPC-like cells contributed by each patient, based on scRNA-Seq and scATAC-Seq data. (G) Quiescence, apoptosis, and ribosome biogenesis signature gene scores for BM HSC/MPPs from normal donors, HSPC-like cells, and CD19+ blasts. Scores were calculated as the sum of z-scores (across all cells) of all genes of a signature. P values were computed using the Wilcoxon test. (H) Pathways enriched comparing HSC/MPP-like cells and BM HSC/MPPs from normal donors. Enriched pathways were identified using the AUCell method. Heatmap shows the top 20 enriched pathways for HSC/MPP-like cells and normal HSC/MPPs, respectively. Barplot on the left shows the adjusted P value for enrichment. (I) Heatmap of differential TF motif accessibility in HSC/MPP-like cells compared with normal BM HSC/MPPs. Values are z-score normalized deviation scores calculated using chromVAR. TFs with differential accessibility between HSC/MPP-like cells and normal HSC/MPPs were identified using Wilcoxon test of the normalized deviation scores between the 2 groups with an FDR cutoff <0.05. (J) Transcriptional regulation network distinguishing HSC/MPP-like cells from normal HSC/MPPs. For clarity, only the part of the TRN involving AP-1, NFKB, STAT, and IRF factors is shown. Nodes represent either enriched TFs or differentially expressed genes in the HSC/MPP-like blasts vs normal HSC/MPPs. Node color is proportional to the −log10(FDR) of differential expression, with red being upregulation and green being downregulation. Edge line thickness is proportional to the −log10(FDR) of the linear regression coefficient for the predicted enhancer-promoter interaction. (K) Example MHC class I genes upregulated in HSC/MPP-like cells. Left panels, aggregated scATAC-Seq signals in normal HSC/MPPs, HSC/MPP-like cells, and CD19+ blasts. Putative enhancers for each gene are highlighted in yellow. Motifs of STAT or NFKB or IRF transcription factors overlapping the enhancers are indicated at the top. Right panels, violin plots for normalized expression of the selected genes in the 3 cell types. *Adjusted P value <1e-10.
Figure 5.
Figure 5.
An immunosuppressive circuit between HSPC-like cells and cytotoxic lymphocytes in younger patients. (A) UMAP of scRNA-Seq data for normal immune cells in 18 KMT2A-r patients. Number of sequenced cells is indicated. (B) NK T cells are the major source of IFNG in patients. Shown are violin plots of IFNG expression in various immune cell populations in both KMT2A-r patients and healthy donors. HD, healthy donor; PT, patient. (C) Upregulated IFNG signaling in the HSPC-like population in younger patients. Left, barplot showing younger patients have a higher fraction of NK T cells expressing IFNG. Right, barplot showing IFGN receptor 2 gene (IFNGR2) was expressed higher in HPSC-like cells in the PB of younger infants with ALL compared with normal BM HSC/MPPs. (D) Activating and suppressive signaling pathways for NK cell cytotoxicity induced by IFNG signaling in blasts. Y-axis, potential for inducing NK cell cytotoxicity based on combined normalized expression of genes in activating and suppressive pathways in HSPC-like cells, CD19+ blasts, and normal HSC/MPPs. (E) Schematic overview of blast and NK cell coculture experiment. (F) Percentage of HSPC-like cells and CD19+ blasts killed by NK cells. Dots represent different patient samples. P values were computed using Student t-test. (G) Predicted L-R interactions between the leukemia cell containing HSPC-like population (left panel) or CD19+ blasts (right panel) and 2 major classes of cytotoxic lymphocytes, CD8+ T cells and NK cells. Red, blue, and gray arcs, suppressive, activating, and unknown interactions, respectively. (H) Cytotoxicity scores of NK and CD8+ T cells based on combined activating and suppressive signaling between the cytotoxic lymphocyte and the HSPC-like/blast populations via L-R pairs (see supplemental Methods for details). L-R pairs were based on those in panel E.
Figure 6.
Figure 6.
Preexisting lymphomyeloid primed progenitor and myeloid blasts in treatment-naive patients as indicators of lineage switch. (A) Frequencies of CD19+ blasts that were projected to the myeloid lineage (GMPs, monocytes, and dendritic cells) in all 18 infant KMT2A-r patients based on scRNA-Seq and scATAC-Seq data. (B) Projection of patient PAYZLC data onto normal hematopoietic trajectory. Top panel, projection of scRNA-Seq data. Bottom panel, projection of scATAC-Seq data. Gray dots, cells from healthy donors; colored dots, patient cells. (C) Volcano plot for differentially expressed genes between M-lineage blasts and B-lineage blasts. Analysis was based on projected blasts from all 18 patients. DEGs were identified with the cutoff of abs(log2FC) >0.5 and FDR <0.01. Those with abs(log2FC) >1 are highlighted in blue. (D) Violin plots for representative signature genes in M-lineage blasts and B-lineage blasts. (E) Heatmap of differential TF motif accessibility in B-lineage and myeloid-lineage blasts. Analysis was based on projected blasts from 18 patients. Values are z-score normalized deviation scores calculated using chromVAR. TFs with differential accessibility between B-lineage and myeloid-lineage blasts were identified using Wilcoxon test of the normalized deviation scores between the 2 groups with an FDR cutoff <0.05. (F-G) UMAP of scRNA-Seq (F) and scATAC-Seq (G) data for a pediatric KMT2A-r patient with paired samples before and after lineage switch. Left panel, UMAP of paired samples, colored by assigned cell populations. Total numbers of sequenced cells are indicated. Right panel, projection of patient cells to the normal hematopoietic trajectory. Gray dots, cells from healthy donors; colored dots, patient cells. (H) Fraction of B-, myeloid-lineage, and LMPP blasts before and after lineage switch. Top panel, fraction based on scRNA-Seq data; bottom panel, fraction based on scATAC-Seq data. (I) Violin plots of gene expression of B-lineage and myeloid-lineage marker genes before and after lineage switch. (J) Enriched pathways among differentially expressed genes between normal LMPP from healthy donors and LMPP-like blasts in patient samples before lineage switch.

Comment in

References

    1. Meyer C, Burmeister T, Gröger D, et al. . The MLL recombinome of acute leukemias in 2017. Leukemia. 2018;32(2):273-284. - PMC - PubMed
    1. Muntean AG, Hess JL. The pathogenesis of mixed-lineage leukemia. Annu Rev Pathol. 2012;7(1):283-301. - PMC - PubMed
    1. Tasian SK, Hunger SP. Genomic characterization of paediatric acute lymphoblastic leukaemia: an opportunity for precision medicine therapeutics. Br J Haematol. 2017;176(6):867-882. - PMC - PubMed
    1. Pieters R, De Lorenzo P, Ancliffe P, et al. . Outcome of infants younger than 1 year with acute lymphoblastic leukemia treated with the interfant-06 protocol: results from an International Phase III Randomized Study. J Clin Oncol. 2019;37(25):2246-2256. - PubMed
    1. Brown P, Pieters R, Biondi A. How I treat infant leukemia. Blood. 2019;133(3):205-214. - PubMed

Publication types

MeSH terms

Substances