. 2022 Feb 4;220(2):iyab218.
doi: 10.1093/genetics/iyab218.

The auxin-inducible degron 2 (AID2) system enables controlled protein knockdown during embryogenesis and development in Caenorhabditis elegans

Affiliations

The auxin-inducible degron 2 (AID2) system enables controlled protein knockdown during embryogenesis and development in Caenorhabditis elegans

Takefumi Negishi et al. Genetics. .

Abstract

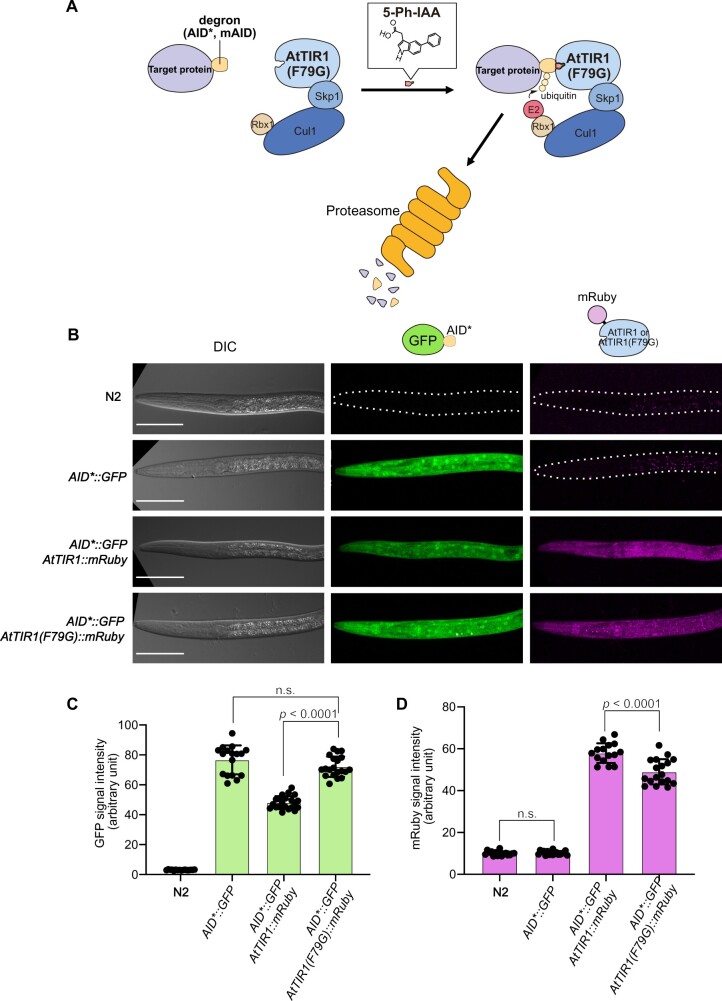
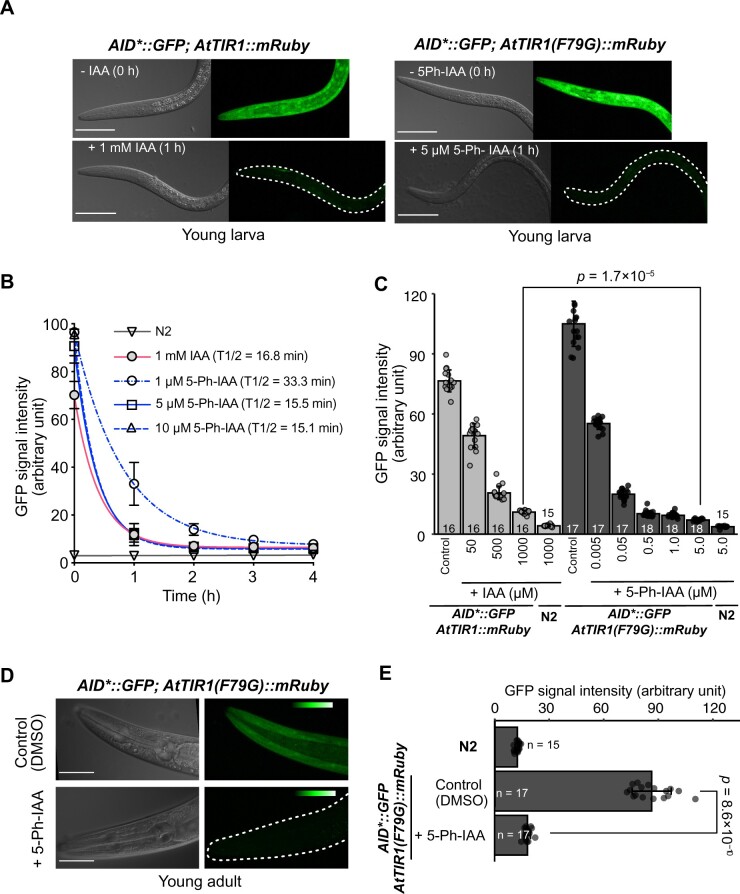
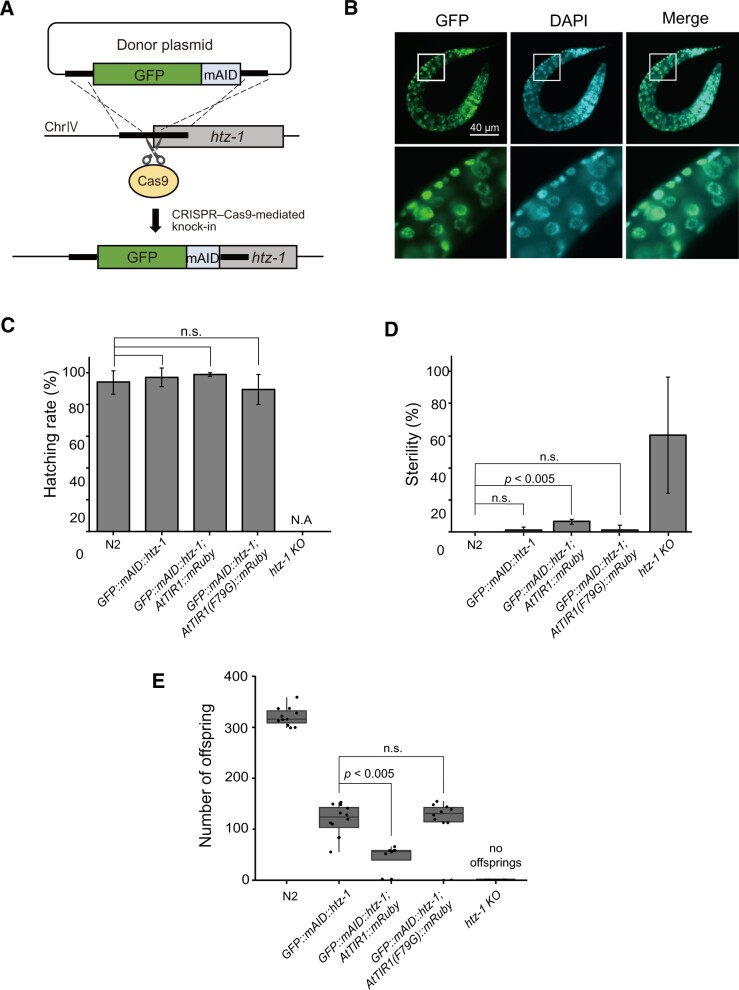
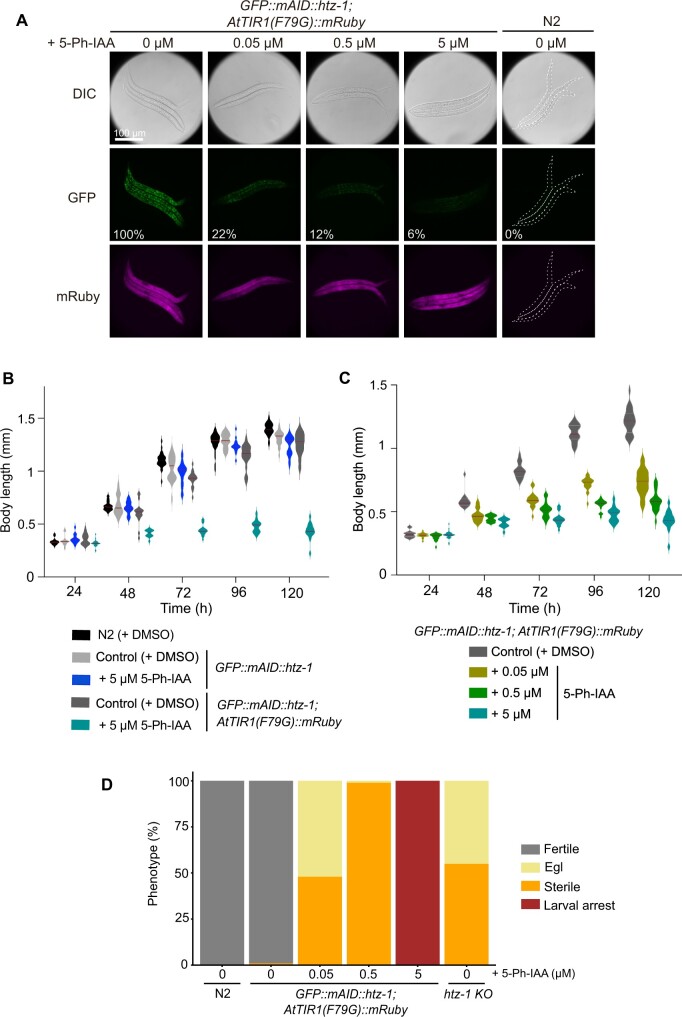
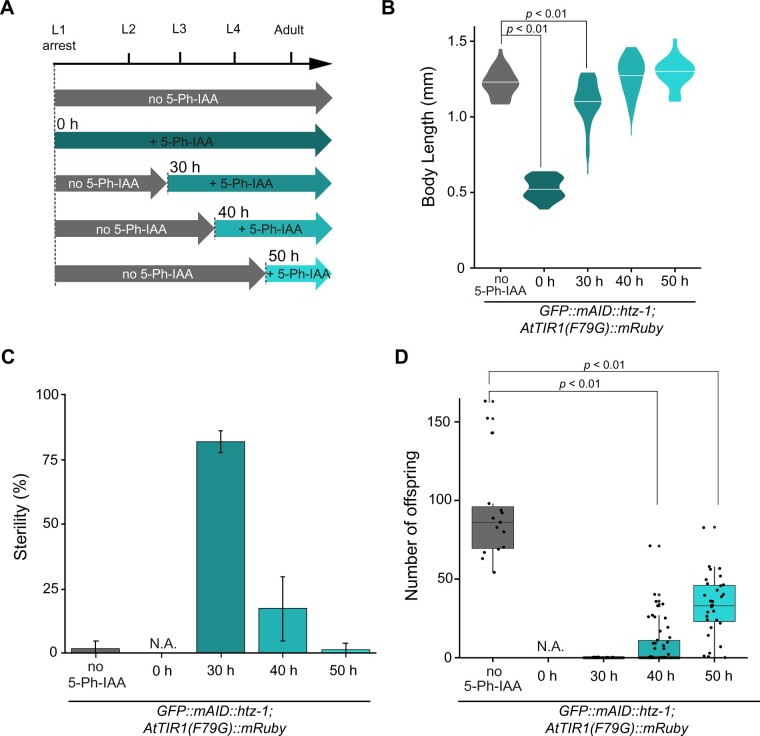
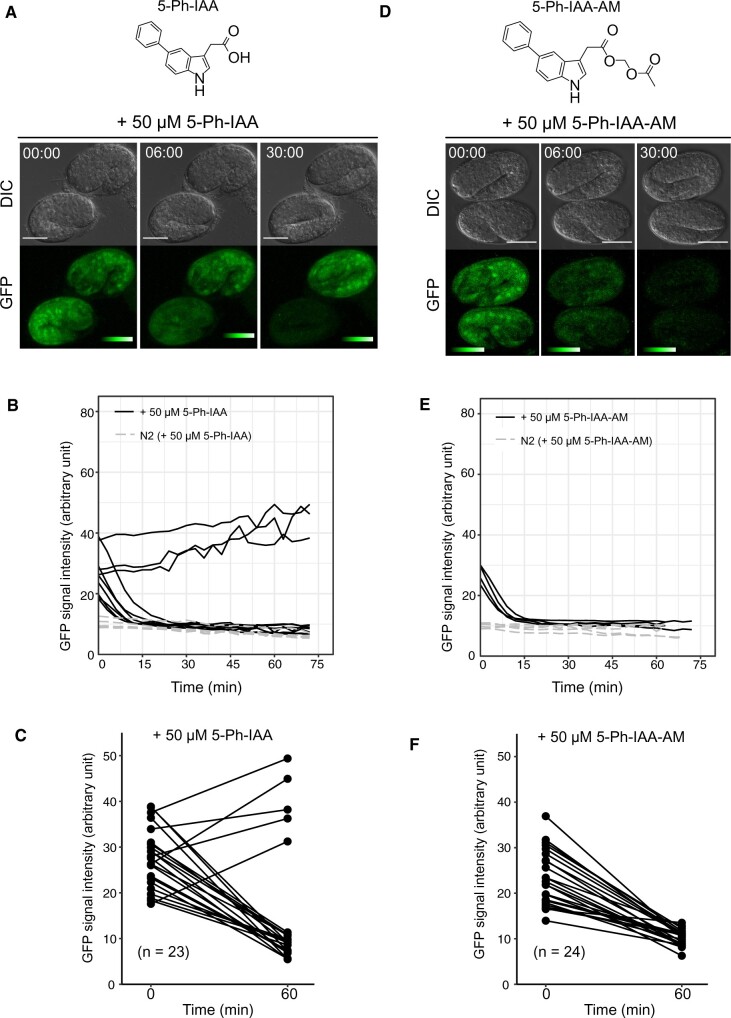
Targeted protein degradation using the auxin-inducible degron (AID) system is garnering attention in the research field of Caenorhabditis elegans, because of the rapid and efficient target depletion it affords, which can be controlled by treating the animals with the phytohormone auxin. However, the current AID system has drawbacks, i.e., leaky degradation in the absence of auxin and the requirement for high auxin doses. Furthermore, it is challenging to deplete degron-fused proteins in embryos because of their eggshell, which blocks auxin permeability. Here, we apply an improved AID2 system utilizing AtTIR1(F79G) and 5-phenyl-indole-3-acetic acid (5-Ph-IAA) to C. elegans and demonstrated that it confers better degradation control vs the previous system by suppressing leaky degradation and inducing sharp degradation using 1,300-fold lower 5-Ph-IAA doses. We successfully degraded the endogenous histone H2A.Z protein fused to an mAID degron and disclosed its requirement in larval growth and reproduction, regardless of the presence of maternally inherited H2A.Z molecules. Moreover, we developed an eggshell-permeable 5-Ph-IAA analog, 5-Ph-IAA-AM, that affords an enhanced degradation in laid embryos. Our improved system will contribute to the disclosure of the roles of proteins in C. elegans, in particular those that are involved in embryogenesis and development, through temporally controlled protein degradation.

Keywords: Caenorhabditis elegans; 5-Ph-IAA; 5-Ph-IAA-AM; AID; auxin; degron; histone H2A.Z; protein knockdown; targeted protein degradation.


Figures

Figure 1
Figure 1
Generation of C. elegans strains for testing the AID and AID2 systems. (A) Schematic illustration of the AID2 system. The AID* and mAID tags are recognized by AtTIR1(F79G) bound with 5-Ph-IAA. (B) Representative images of the strains used in the evaluations. The genotype of each strain is shown on the left side. All scale bars, 50 µm. (C, D) Quantification of the mean intensity of the GFP and mRuby signals, respectively. Error bars, standard deviation. The statistical analysis was performed using the unpaired t test.
Figure 2
Figure 2
Induced degradation of the AID*::GFP reporter by the AID and AID2 systems. (A) Representative images acquired before and after ligand treatment. The indicated larva was treated with 1 mM IAA (left) or 5 µM 5-Ph-IAA for 1 h. All scale bars, 50 µm. (B) Time-course evaluation of the mean GFP intensity in the larvae treated with the ligands. The red line shows the GFP level in the larvae expressing AtTIR1::mRuby treated with 1 mM IAA (n > 7). The other lines indicate the GFP level in the larvae expressing AtTIR1(F79G)::mRuby treated with 1, 5, and 10 µM 5-Ph-IAA (n = 7, 12, and 7, respectively). Error bars, standard deviation. The T1/2 for each condition is indicated in the graph. (C) Quantification of the GFP level in the indicated larval strains treated over one generation with different concentrations of IAA or 5-Ph-IAA. The numbers of treated animals are shown at the bottom of each column. Error bars, standard deviation. The statistical analysis was performed between the treatment with 1000 µM IAA and the treatment with 5 µM 5-Ph-IAA (Wilcoxon rank-sum test, P = 1.7 × 10⁻⁵). (D) Representative images of reporter protein expression in a young adult expressing AtTIR1(F79G)::mRuby after treatment with DMSO (upper panels) or 5 µM 5-Ph-IAA (lower panels) for 4 h. The color table indicates the intensity of the fluorescent signal. Scale bars, 50 µm. (E) Quantification of mean GFP intensity in the adults treated with 5-Ph-IAA for 4 h. The numbers of treated animals are shown on the left side of each column. Error bars, standard deviation. The statistical analysis was performed between the treatment with DMSO and the treatment with 5 µM 5-Ph-IAA (Wilcoxon rank-sum test, P = 8.6 × 10⁻¹⁰).
Figure 3
Figure 3
The AID2 system suppresses leaky phenotypes of a mutant strain expressing the GFP::mAID-fused histone variant H2A.Z (HTZ-1), which are observed with an analogous mutant strain generated by using the original AID system. (A) Schematic illustration showing tagging of the endogenous htz-1 gene with GFP::mAID. (B) Microscopic observation of GFP::mAID::HTZ-1 in L1 larvae after DAPI staining. Scale bar, 40 µm. (C) The hatching efficiency of the indicated strains was tested (n = 3, more than 20 animals per experiment). (D) The sterile percentage of the indicated strains. Statistical significance was tested using the t-test (n = 3 or 4, more than 20 animals per experiment). (E) The offspring number of the indicated strains was tested (n ≥ 8). The statistical analysis was performed using the unpaired t test.
Figure 4
Figure 4
Phenotypic analyses after targeted depletion of HTZ-1. (A) Targeted depletion of GFP::mAID::HTZ-1 was observed in the presence of the indicated concentrations of 5-Ph-IAA. Images of differential interference contrast (DIC, upper), GFP (middle), and mRuby (bottom) are shown. The numbers in the middle panels indicate the relative intensity of the GFP signal (0% in the control N2 strain and 100% in the GFP::mAID::htz-1; AtTIR1(F79G)::mRuby strain without 5-Ph-IAA treatment). Scale bar, 100 µm. (B) The growth of wildtype N2 and the strain expressing GFP::mAID::HTZ-1 with or without AtTIR1(F79G)::mRuby were tested in the presence or absence of 5 µM 5-Ph-IAA. The body length was measured at the indicated time points. More than 11 animals were counted for each time point. (C) Embryos expressing GFP::mAID::HTZ-1 and AtTIR1(F79G)::mRuby were treated with 0.05, 0.5, or 5 µM 5-Ph-IAA for testing the body length at the indicated time points. More than 11 animals were counted for each point. (D) Phenotypes of the GFP::mAID::htz-1; AtTIR1(F79G)::mRuby strain treated with the indicated concentration of 5-Ph-IAA (n = 92, 96, 95, 97, and 37 for N2, 0, 0.05, 0.5, and 5 µM 5-Ph-IAA, respectively). The phenotypes of the htz-1-KO strain were also tested (n = 77). The statistical analysis was performed using the unpaired t test.
Figure 5
Figure 5
Stage-specific degradation of HTZ-1 yields differential phenotypes regarding larval growth, sterility and progeny number. (A) Experimental scheme showing the timing of 5 µM 5-Ph-IAA addition. (B) Body length of the GFP::mAID::htz-1;AtTIR1(F79G)::mRuby strain and htz-1-KO strain at 120 h in each experiment (n ≥ 19). (C) Sterility of the GFP::mAID::htz-1; AtTIR1(F79G)::mRuby strain in each experiment (n = 3, more than 20 animals per experiment). (D) Number of viable progeny from the GFP::mAID::htz-1; AtTIR1(F79G)::mRuby strain treated with DMSO (n = 15) or 5 µM 5-Ph-IAA at 30 (n = 37), 40 (n =50), and 50 h (n = 32).
Figure 6
Figure 6
5-Ph-IAA-AM triggers better degradation in the C. elegans embryos. (A) Chemical structure of 5-Ph-IAA (top). Time-lapse images of the embryos (AID*::GFP; AtTIR1(F79G)::mRuby) treated with 50 µM 5-Ph-IAA (bottom). Scale bars, 20 µm. The color table indicates the intensity of the fluorescent signal. (B) GFP intensity in the 10 and 5 embryos [AID*::GFP; AtTIR1(F79G)::mRuby and wildtype N2, respectively] treated with 50 µM 5-Ph-IAA. Images were captured at 3 min intervals. (C) Efficacy of triggering reporter degradation using 50 µM 5-Ph-IAA. The GFP intensity was measured at 0 and 60 min (n = 23). (D) Chemical structure of 5-Ph-IAA-AM (top). Time-lapse images of the embryos [AID*::GFP; AtTIR1(F79G)::mRuby] treated with 50 µM 5-Ph-IAA-AM (bottom). Scale bars, 20 µm. The color table indicates the intensity of the fluorescent signal. (E) GFP intensity of the 4 and 5 embryos [AID*::GFP; AtTIR1(F79G)::mRuby and wildtype N2, respectively] treated with 50 µM 5-Ph-IAA-AM. Images were captured at 3 min intervals. (F) Efficacy of triggering reporter degradation using 50 µM 5-Ph-IAA-AM. GFP intensity was measured at 0 and 60 min (n = 24).

References

    1. Ashley GE, Duong T, Levenson MT, Martinez MAQ, Johnson LC, et al.2021. An expanded auxin-inducible degron toolkit for Caenorhabditis elegans. Genetics. 217:7250–7257. doi:10.1093/genetics/iyab006. - PMC - PubMed
    1. Bao Z, Murray JI.. 2011. Protocol mounting Caenorhabditis elegans embryos for live imaging of embryogenesis. Cold Spring Harb Protoc. 2011:pdb.prot065599.doi:10.1101/pdb.prot065599. - DOI - PubMed
    1. Blackwell TK, Sewell AK, Wu Z, Han M.. 2019. TOR signaling in Caenorhabditis elegans development, metabolism, and aging. Genetics. 213:329–360. doi:10.1534/genetics.119.302504. - DOI - PMC - PubMed
    1. Brenner S. 1974. The genetics of Caenorhabditis elegans. Genetics. 77:71–94. doi:10.1093/genetics/77.1.71. - DOI - PMC - PubMed
    1. Carvalho A, Olson SK, Gutierrez E, Zhang K, Noble LB, et al.2011. Acute drug treatment in the early C. elegans embryo. PLoS One. 6:e24656. doi:10.1371/journal.pone.0024656. - DOI - PMC - PubMed

Publication types

MeSH terms