

Inclusion of cancer-associated fibroblasts in drug screening assays to evaluate pancreatic cancer resistance to therapeutic drugs
- PMID: 34865180
- PMCID: PMC9905179
- DOI: 10.1007/s13105-021-00857-2
Inclusion of cancer-associated fibroblasts in drug screening assays to evaluate pancreatic cancer resistance to therapeutic drugs
Abstract
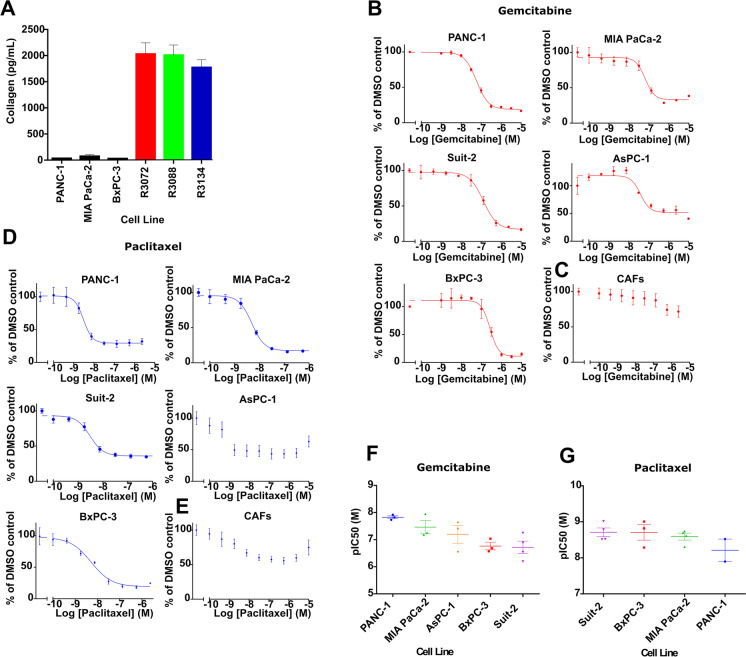
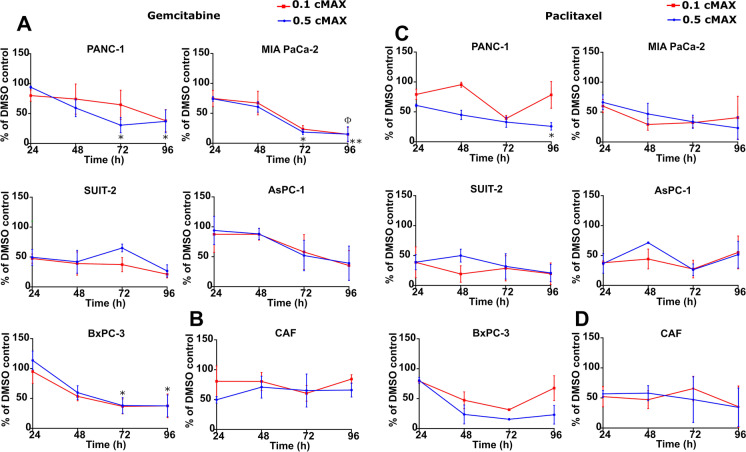
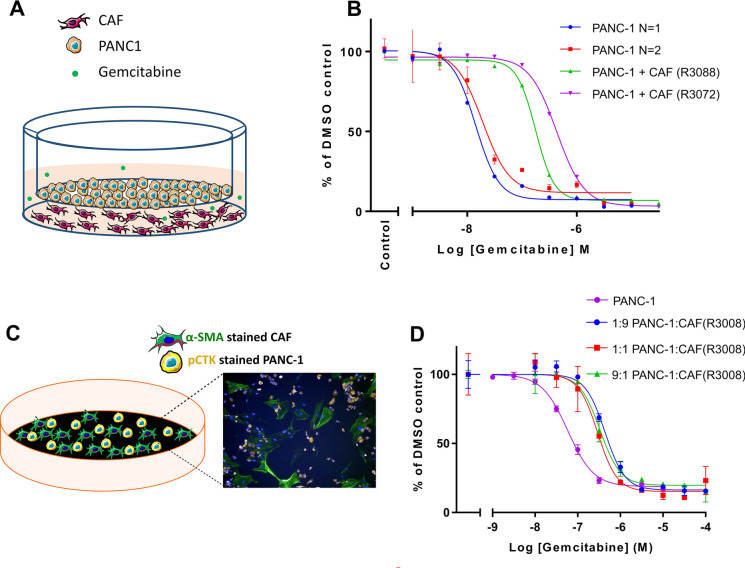
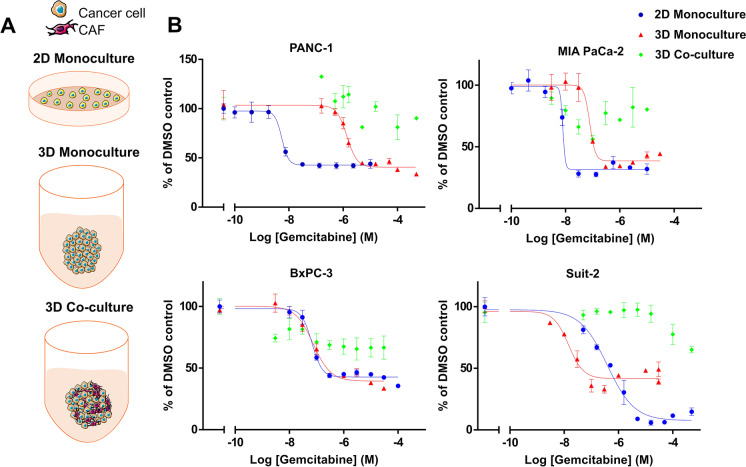
Pancreatic ductal adenocarcinoma (PDAC) is characterised by a pro-inflammatory stroma and multi-faceted microenvironment that promotes and maintains tumorigenesis. However, the models used to test new and emerging therapies for PDAC have not increased in complexity to keep pace with our understanding of the human disease. Promising therapies that pass pre-clinical testing often fail in pancreatic cancer clinical trials. The objective of this study was to investigate whether changes in the drug-dosing regimen or the addition of cancer-associated fibroblasts (CAFs) to current existing models can impact the efficacy of chemotherapy drugs used in the clinic. Here, we reveal that gemcitabine and paclitaxel markedly reduce the viability of pancreatic cell lines, but not CAFs, when cultured in 2D. Following the use of an in vitro drug pulsing experiment, PDAC cell lines showed sensitivity to gemcitabine and paclitaxel. However, CAFs were less sensitive to pulsing with gemcitabine compared to their response to paclitaxel. We also identify that a 3D co-culture model of MIA PaCa-2 or PANC-1 with CAFs showed an increased chemoresistance to gemcitabine when compared to standard 2D mono-cultures a difference to paclitaxel which showed no measurable difference between the 2D and 3D models, suggesting a complex interaction between the drug in study and the cell type used. Changes to standard 2D mono-culture-based assays and implementation of 3D co-culture assays lend complexity to established models and could provide tools for identifying therapies that will match clinically the success observed with in vitro models, thereby aiding in the discovery of novel therapies.
Keywords: CAFs; Drug screening; PDAC chemotherapy; PDAC resistance.
© 2021. The Author(s).
Conflict of interest statement
The authors declare no competing interests.
Figures
Similar articles
-
Patient-specific modeling of stroma-mediated chemoresistance of pancreatic cancer using a three-dimensional organoid-fibroblast co-culture system.J Exp Clin Cancer Res. 2022 Oct 22;41(1):312. doi: 10.1186/s13046-022-02519-7. J Exp Clin Cancer Res. 2022. PMID: 36273171 Free PMC article.
-
Tumor-stromal cross-talk modulating the therapeutic response in pancreatic cancer.Hepatobiliary Pancreat Dis Int. 2018 Oct;17(5):461-472. doi: 10.1016/j.hbpd.2018.09.004. Epub 2018 Sep 7. Hepatobiliary Pancreat Dis Int. 2018. PMID: 30243879
-
Combining gemcitabine and MSC delivering soluble TRAIL to target pancreatic adenocarcinoma and its stroma.Cell Rep Med. 2024 Aug 20;5(8):101685. doi: 10.1016/j.xcrm.2024.101685. Cell Rep Med. 2024. PMID: 39168103 Free PMC article.
-
The multi-faceted roles of cancer-associated fibroblasts in pancreatic cancer.Cell Signal. 2025 Mar;127:111584. doi: 10.1016/j.cellsig.2024.111584. Epub 2025 Jan 3. Cell Signal. 2025. PMID: 39756502 Review.
-
Opportunities and delusions regarding drug delivery targeting pancreatic cancer-associated fibroblasts.Adv Drug Deliv Rev. 2021 May;172:37-51. doi: 10.1016/j.addr.2021.02.012. Epub 2021 Mar 8. Adv Drug Deliv Rev. 2021. PMID: 33705881 Review.
Cited by
-
Modulation of Epithelial-Mesenchymal Transition Is a Possible Underlying Mechanism for Inducing Chemoresistance in MIA PaCa-2 Cells against Gemcitabine and Paclitaxel.Biomedicines. 2024 May 3;12(5):1011. doi: 10.3390/biomedicines12051011. Biomedicines. 2024. PMID: 38790973 Free PMC article.
-
Spheroids and organoids derived from colorectal cancer as tools for in vitro drug screening.Explor Target Antitumor Ther. 2024;5(2):409-431. doi: 10.37349/etat.2024.00226. Epub 2024 Apr 25. Explor Target Antitumor Ther. 2024. PMID: 38745769 Free PMC article. Review.
-
High-throughput non-homogenous 3D polycaprolactone scaffold for cancer cell and cancer-associated fibroblast mini-tumors to evaluate drug treatment response.Toxicol Rep. 2024 Dec 12;14:101863. doi: 10.1016/j.toxrep.2024.101863. eCollection 2025 Jun. Toxicol Rep. 2024. PMID: 39758801 Free PMC article.
-
Tunable hybrid hydrogels with multicellular spheroids for modeling desmoplastic pancreatic cancer.Bioact Mater. 2023 Feb 15;25:360-373. doi: 10.1016/j.bioactmat.2023.02.005. eCollection 2023 Jul. Bioact Mater. 2023. PMID: 36879666 Free PMC article.
-
Indole Diketopiperazine Alkaloids from the Marine Sediment-Derived Fungus Aspergillus chevalieri against Pancreatic Ductal Adenocarcinoma.Mar Drugs. 2023 Dec 20;22(1):5. doi: 10.3390/md22010005. Mar Drugs. 2023. PMID: 38276643 Free PMC article.
References
MeSH terms
Substances
Grants and funding
LinkOut - more resources
Full Text Sources
Medical
