

Permafrost thaw driven changes in hydrology and vegetation cover increase trace gas emissions and climate forcing in Stordalen Mire from 1970 to 2014
- PMID: 34865532
- PMCID: PMC8646141
- DOI: 10.1098/rsta.2021.0022
Permafrost thaw driven changes in hydrology and vegetation cover increase trace gas emissions and climate forcing in Stordalen Mire from 1970 to 2014
Abstract
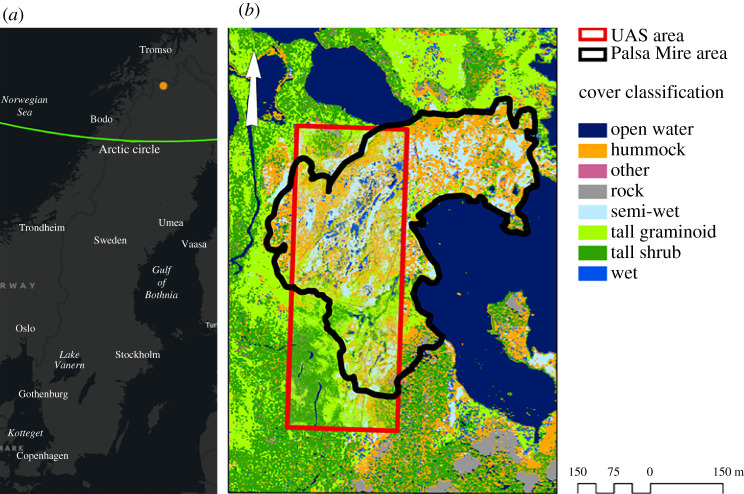
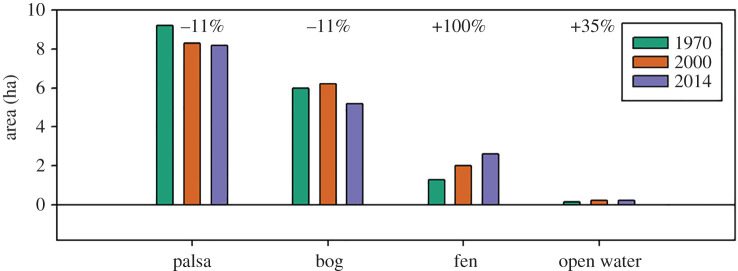
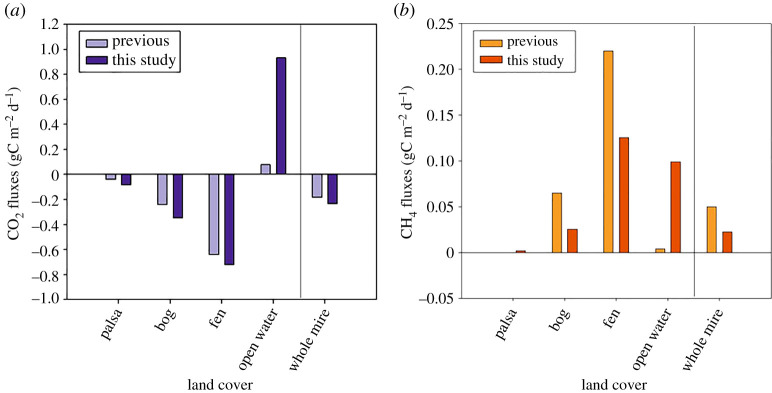
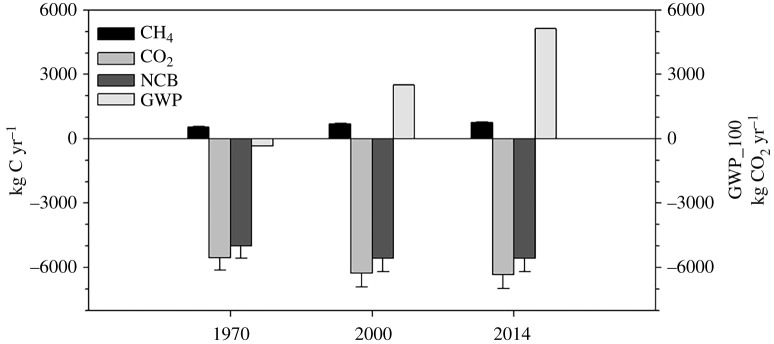
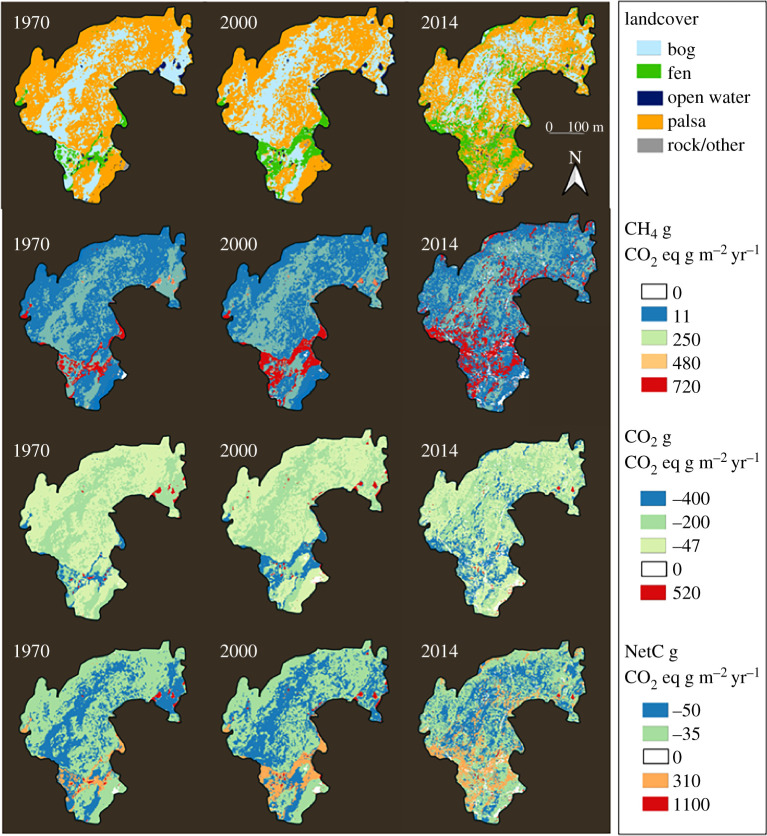
Permafrost thaw increases active layer thickness, changes landscape hydrology and influences vegetation species composition. These changes alter belowground microbial and geochemical processes, affecting production, consumption and net emission rates of climate forcing trace gases. Net carbon dioxide (CO2) and methane (CH4) fluxes determine the radiative forcing contribution from these climate-sensitive ecosystems. Permafrost peatlands may be a mosaic of dry frozen hummocks, semi-thawed or perched sphagnum dominated areas, wet permafrost-free sedge dominated sites and open water ponds. We revisited estimates of climate forcing made for 1970 and 2000 for Stordalen Mire in northern Sweden and found the trend of increasing forcing continued into 2014. The Mire continued to transition from dry permafrost to sedge and open water areas, increasing by 100% and 35%, respectively, over the 45-year period, causing the net radiative forcing of Stordalen Mire to shift from negative to positive. This trend is driven by transitioning vegetation community composition, improved estimates of annual CO2 and CH4 exchange and a 22% increase in the IPCC's 100-year global warming potential (GWP_100) value for CH4. These results indicate that discontinuous permafrost ecosystems, while still remaining a net overall sink of C, can become a positive feedback to climate change on decadal timescales. This article is part of a discussion meeting issue 'Rising methane: is warming feeding warming? (part 2)'.
Keywords: Arctic; landcover; methane; permafrost; radiative forcing; remote sensing.
Figures
References
-
- Christensen TR, Johansson T, Akerman HJ, Mastepanov M, Malmer N, Friborg T, Crill PM, Svensson BH. 2004. Thawing sub-arctic permafrost: effects on vegetation and methane emissions. Geophys. Res. Lett. 31, L04501. (10.1029/2003GL018680) - DOI
-
- Overland J, et al. 2019. The urgency of Arctic change. Polar Sci. 21, 6-13. (10.1016/j.polar.2018.11.008) - DOI
-
- Payette S, Delwaide A, Caccianiga M, Beauchemin M. 2004. Accelerated thawing of subarctic peatland permafrost over the last 50 years. Geophys. Res. Lett. 31, L18208. (10.1029/2004GL020358) - DOI
-
- Johnston CE, Ewing SA, Harden JW, Varner RK, Wickland KP, Koch JC, Fuller CC, Manies K, Jorgenson MT. 2014. Effect of permafrost thaw on CO2 and CH4 exchange in a western Alaska peatland chronosequence. Environ. Res. Lett. 9, 085004. (10.1088/1748-9326/9/8/085004) - DOI
-
- O'Donnell JA, Jorgenson MT, Harden JW, McGuire AD, Kanevskiy MZ, Wickland KP. 2012. The effects of permafrost thaw on soil hydrologic, thermal, and carbon dynamics in an Alaskan peatland. Ecosystems 15, 213-229. (10.1007/s10021-011-9504-0) - DOI
MeSH terms
Substances
LinkOut - more resources
Full Text Sources
