

A Prognostic Model Based on Clinicopathological Features and Inflammation- and Nutrition-Related Indicators Predicts Overall Survival in Surgical Patients With Tongue Squamous Cell Carcinoma
- PMID: 34866500
- PMCID: PMC8652185
- DOI: 10.1177/15330338211043048
A Prognostic Model Based on Clinicopathological Features and Inflammation- and Nutrition-Related Indicators Predicts Overall Survival in Surgical Patients With Tongue Squamous Cell Carcinoma
Abstract
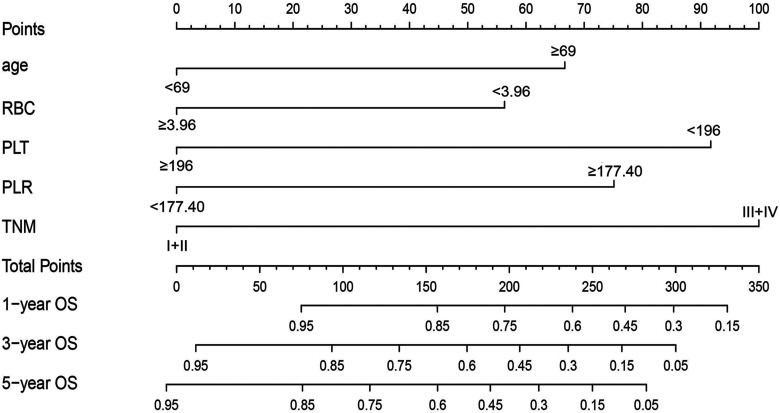
Objectives: It is reported that inflammation- and nutrition-related indicators have a prognostic impact on multiple cancers. Here we aimed to identify a prognostic nomogram model for prediction of overall survival (OS) in surgical patients with tongue squamous cell carcinoma (TSCC). Methods: The retrospective data of 172 TSCC patients were charted from the Cancer Hospital of Shantou University Medical College between 2008 and 2019. A Cox regression analysis was performed to determine prognostic factors to establish a nomogram and predict OS. The predictive accuracy of the model was analyzed by the calibration curves and the concordance index (C-index). The difference of OS was analyzed by Kaplan-Meier survival analysis. Results: Multivariate analysis showed age, tumor node metastasis (TNM) stage, red blood cell, platelets, and platelet-to-lymphocyte ratio were independent prognostic factors for OS, which were used to build the prognostic nomogram model. The C-index of the model for OS was 0.794 (95% CI = 0.729-0.860), which was higher than that of TNM stage 0.685 (95% CI = 0.605-0.765). In addition, decision curve analysis also showed the nomogram model had improved predictive accuracy and discriminatory performance for OS, compared to the TNM stage. According to the prognostic model risk score, patients in the high-risk subgroup had a lower 5-year OS rate than that in a low-risk subgroup (23% vs 49%, P < .0001). Conclusions: The nomogram model based on clinicopathological features inflammation- and nutrition-related indicators represents a promising tool that might complement the TNM stage in the prognosis of TSCC.
Keywords: clinical features; inflammation; nutrition; prognosis; tongue squamous cell carcinoma.
Conflict of interest statement
Figures


Similar articles
-
[Establishment and verification of a prognostic nomogram for survival of tongue squamous cell carcinoma patients who underwent cervical dissection].Beijing Da Xue Xue Bao Yi Xue Ban. 2024 Feb 18;56(1):120-130. doi: 10.19723/j.issn.1671-167X.2024.01.019. Beijing Da Xue Xue Bao Yi Xue Ban. 2024. PMID: 38318906 Free PMC article. Chinese.
-
A novel nomogram for predicting overall survival in patients with tongue squamous cell carcinoma using clinical features and MRI radiomics data: a pilot study.World J Surg Oncol. 2024 Aug 29;22(1):227. doi: 10.1186/s12957-024-03508-0. World J Surg Oncol. 2024. PMID: 39198807 Free PMC article.
-
Nomogram based on clinical characteristics and serological inflammation markers to predict overall survival of oral tongue squamous cell carcinoma patient after surgery.BMC Oral Health. 2021 Dec 27;21(1):667. doi: 10.1186/s12903-021-02028-7. BMC Oral Health. 2021. PMID: 34961504 Free PMC article.
-
Nutritional and immune-related indicators-based Nomogram for predicting overall survival of surgical oral tongue squamous cell carcinoma.Sci Rep. 2023 May 26;13(1):8525. doi: 10.1038/s41598-023-35244-y. Sci Rep. 2023. PMID: 37237026 Free PMC article.
-
Development of a predictive nomogram based on preoperative inflammation-nutrition-related markers for prognosis in locally advanced lip squamous cell carcinoma after surgical treatment.BMC Oral Health. 2025 Feb 20;25(1):268. doi: 10.1186/s12903-025-05663-6. BMC Oral Health. 2025. PMID: 39979915 Free PMC article.
Cited by
-
Pretreatment systemic immune-inflammation index and lymphocyte-to-monocyte ratio as prognostic factors in oral cavity cancer: A meta-analysis.Medicine (Baltimore). 2024 Nov 1;103(44):e40182. doi: 10.1097/MD.0000000000040182. Medicine (Baltimore). 2024. PMID: 39496022 Free PMC article.
-
Prognostic value of platelet-to-lymphocyte ratio in patients with oral squamous cell carcinoma: a systematic review and meta-analysis.BMC Oral Health. 2024 Oct 22;24(1):1262. doi: 10.1186/s12903-024-05026-7. BMC Oral Health. 2024. PMID: 39438883 Free PMC article.
-
Prognostic and clinicopathological role of pretreatment systemic immune-inflammation index in patients with oral squamous cell carcinoma: a meta-analysis.Front Oncol. 2024 Jan 16;13:1303132. doi: 10.3389/fonc.2023.1303132. eCollection 2023. Front Oncol. 2024. PMID: 38293698 Free PMC article.
-
Prognostic value of systemic immune-inflammation index and systemic inflammation response index for oral cancers: A systematic review and meta-analysis.Med Oral Patol Oral Cir Bucal. 2024 Nov 1;29(6):e822-e831. doi: 10.4317/medoral.26779. Med Oral Patol Oral Cir Bucal. 2024. PMID: 39396135 Free PMC article.
References
Publication types
MeSH terms
LinkOut - more resources
Full Text Sources
