

A primary effect of palmitic acid on mouse oocytes is the disruption of the structure of the endoplasmic reticulum
- PMID: 34866595
- PMCID: PMC8801006
- DOI: 10.1530/REP-21-0332
A primary effect of palmitic acid on mouse oocytes is the disruption of the structure of the endoplasmic reticulum
Abstract
Exposure of mouse oocytes to saturated fatty acids (FAs) such as palmitic acid (PA) has been shown to increase lipid content and cause an endoplasmic reticulum (ER) stress response and changes in the mitochondrial redox state. PA can also disrupt Ca2+ stores in other cell types. The links between these intracellular changes, or whether they are prevented by mono-unsaturated FAs such as oleic acid (OA), is unclear. Here, we have investigated the effects of FAs on mouse oocytes, that are maturated in vitro, using coherent anti-Stokes Raman scattering and two-photon fluorescence microscopy. When oocytes were matured in the presence of PA, there were changes in the aggregation pattern and size of lipid droplets that were mitigated by co-incubation in OA. Maturation in PA alone also caused a distinctive disruption of the ER structure. This effect was prevented by incubation of OA with PA. In contrast, maturation of mouse oocytes in medium containing PA was not associated with any significant change in the redox state of mitochondria or the Ca2+ content of intracellular stores. These data suggest that a primary effect of saturated FAs such as PA on oocytes is to disrupt the structure of the ER and this is not due to an effect on the mitochondria or Ca2+ stores.
Conflict of interest statement
Karl Swann is on the editorial board of Reproduction. Karl Swann was not involved in the review or editorial process for this paper, on which he is listed as an author.The other authors have nothing to disclose.
Figures
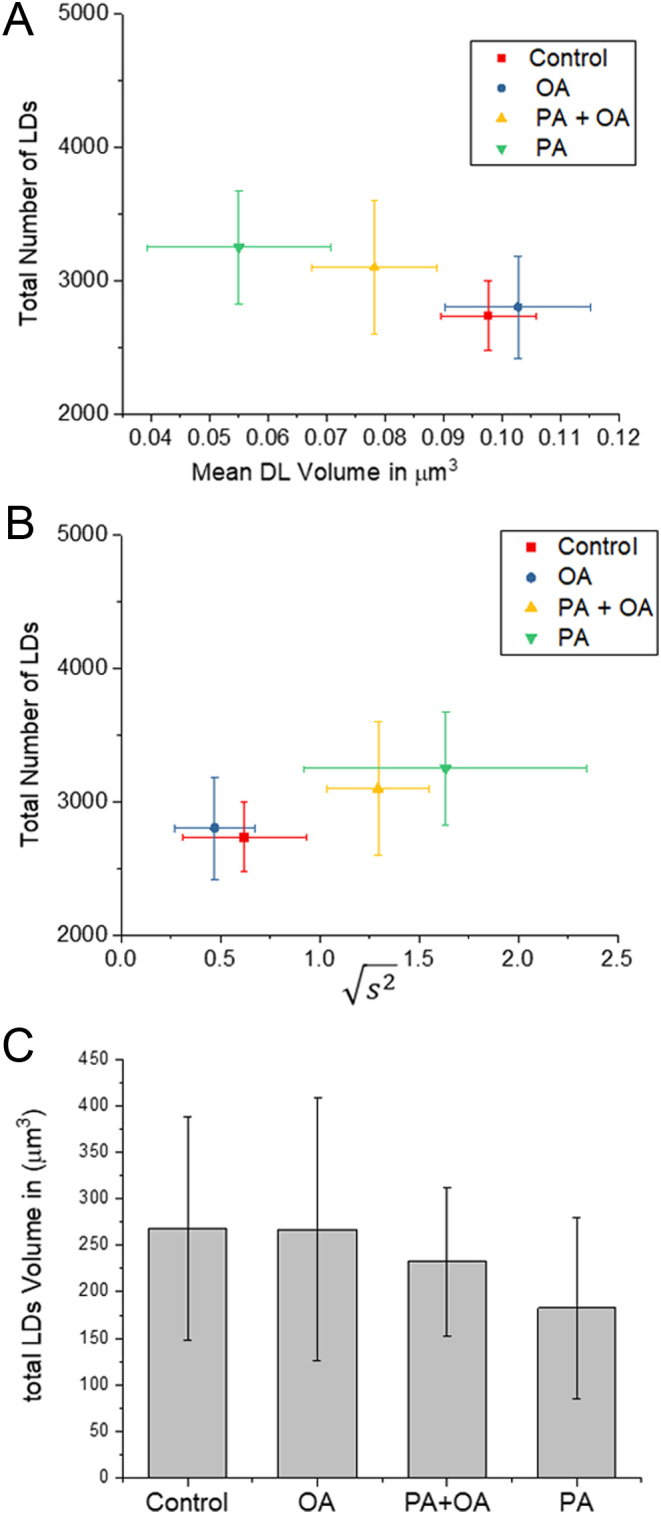
 against the total number of LDs in ensembles of MII oocytes imaged immediately after overnight incubation in standard M2 medium (red square, n = 12), or supplemented with 200 µM PA (green triangle, n = 10), 200 µM OA (blue circle, n = 8) or combination of 200 µM PA and 200 µM OA (yellow triangle, n = 8). The distribution of each variable in the corresponding ensemble is shown as the average ±
Similar articles
-
Oleic acid protects insulin-secreting INS-1E cells against palmitic acid-induced lipotoxicity along with an amelioration of ER stress.Endocrine. 2019 Jun;64(3):512-524. doi: 10.1007/s12020-019-01867-3. Epub 2019 Feb 18. Endocrine. 2019. PMID: 30778898
-
Oleic Acid Counters Impaired Blastocyst Development Induced by Palmitic Acid During Mouse Preimplantation Development: Understanding Obesity-Related Declines in Fertility.Reprod Sci. 2020 Nov;27(11):2038-2051. doi: 10.1007/s43032-020-00223-5. Epub 2020 Jun 15. Reprod Sci. 2020. PMID: 32542540 Free PMC article.
-
Mitochondria-targeted therapy rescues development and quality of embryos derived from oocytes matured under oxidative stress conditions: a bovine in vitro model.Hum Reprod. 2019 Oct 2;34(10):1984-1998. doi: 10.1093/humrep/dez161. Hum Reprod. 2019. PMID: 31625574
-
Fatty Acids: An Insight into the Pathogenesis of Neurodegenerative Diseases and Therapeutic Potential.Int J Mol Sci. 2022 Feb 25;23(5):2577. doi: 10.3390/ijms23052577. Int J Mol Sci. 2022. PMID: 35269720 Free PMC article. Review.
-
Palmitic and Oleic Acid: The Yin and Yang of Fatty Acids in Type 2 Diabetes Mellitus.Trends Endocrinol Metab. 2018 Mar;29(3):178-190. doi: 10.1016/j.tem.2017.11.009. Epub 2017 Dec 28. Trends Endocrinol Metab. 2018. PMID: 29290500 Review.
Cited by
-
Agomelatine alleviates palmitic acid-induced mouse oocyte meiosis defects by restoring mitochondrial function.Int J Obes (Lond). 2025 Jul 28. doi: 10.1038/s41366-025-01825-2. Online ahead of print. Int J Obes (Lond). 2025. PMID: 40721860
-
Carnitines as Mitochondrial Modulators of Oocyte and Embryo Bioenergetics.Antioxidants (Basel). 2022 Apr 8;11(4):745. doi: 10.3390/antiox11040745. Antioxidants (Basel). 2022. PMID: 35453430 Free PMC article. Review.
-
Ovarian aging: energy metabolism of oocytes.J Ovarian Res. 2024 May 31;17(1):118. doi: 10.1186/s13048-024-01427-y. J Ovarian Res. 2024. PMID: 38822408 Free PMC article. Review.
-
A protein-lipid complex that detoxifies free fatty acids.Bioessays. 2023 Mar;45(3):e2200210. doi: 10.1002/bies.202200210. Epub 2022 Dec 30. Bioessays. 2023. PMID: 36585363 Free PMC article.
-
Endoplasmic reticulum in oocytes: spatiotemporal distribution and function.J Assist Reprod Genet. 2023 Jun;40(6):1255-1263. doi: 10.1007/s10815-023-02782-3. Epub 2023 May 12. J Assist Reprod Genet. 2023. PMID: 37171741 Free PMC article.
References
-
- Aardema H, Lolicato F, Van De Lest CHA, Brouwers JF, Vaandrager AB, Van Tol HTA, Roelen BAJ, Vos PLAM, Helms JB, Gadella BM.2013Bovine cumulus cells protect maturing oocytes from increased fatty acid levels by massive intracellular lipid storage. Biology of Reproduction 88164. (10.1095/biolreprod.112.106062) - DOI - PubMed
-
- Bibette J, Leal-Calderon F, Schmitt V, Poulin P.2002Emulsion science – basic principles. An overview – introduction. Springer Tracts in Modern Physics 1811–4.
Publication types
MeSH terms
Substances
Grants and funding
- BB/P007511/1/BB_/Biotechnology and Biological Sciences Research Council/United Kingdom
- BB/P007511/1/BB_/Biotechnology and Biological Sciences Research Council/United Kingdom
- BB/H006575/1/BB_/Biotechnology and Biological Sciences Research Council/United Kingdom
- BB/P007511/1/BB_/Biotechnology and Biological Sciences Research Council/United Kingdom
LinkOut - more resources
Full Text Sources
Research Materials
Miscellaneous
