. 2021 Nov:133:103534.
doi: 10.1016/j.jinteco.2021.103534. Epub 2021 Sep 22.

Global supply chains in the pandemic

Affiliations

Global supply chains in the pandemic

Barthélémy Bonadio et al. J Int Econ. 2021 Nov.

Abstract

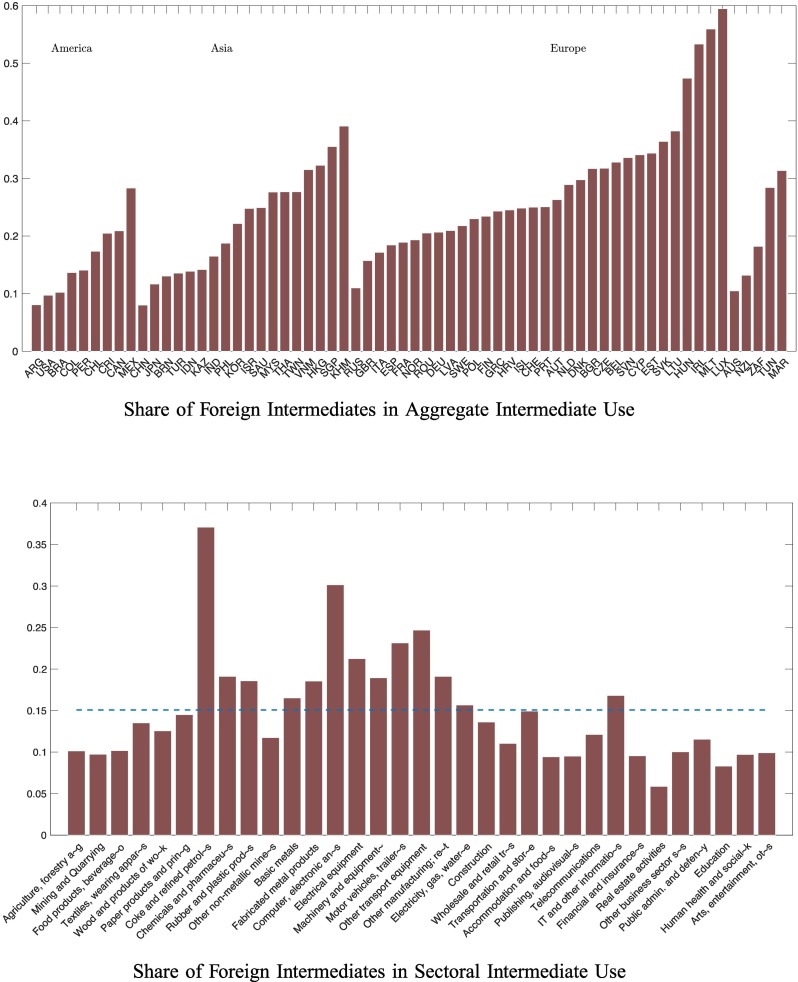
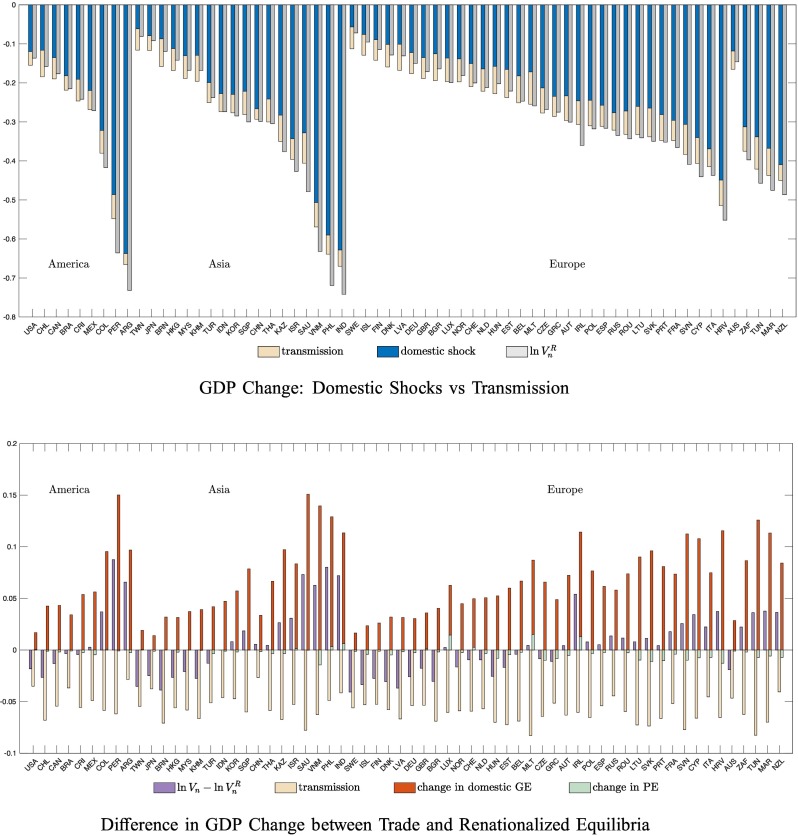
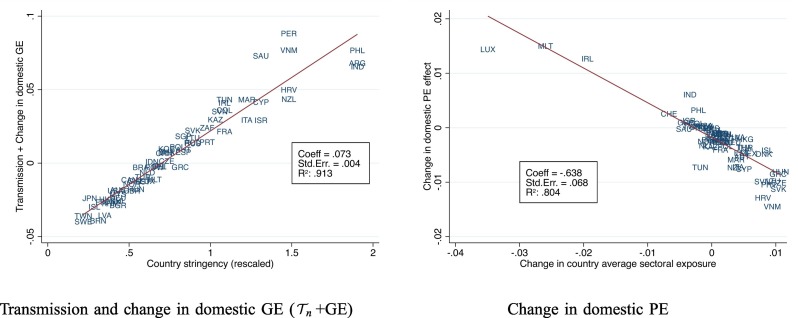
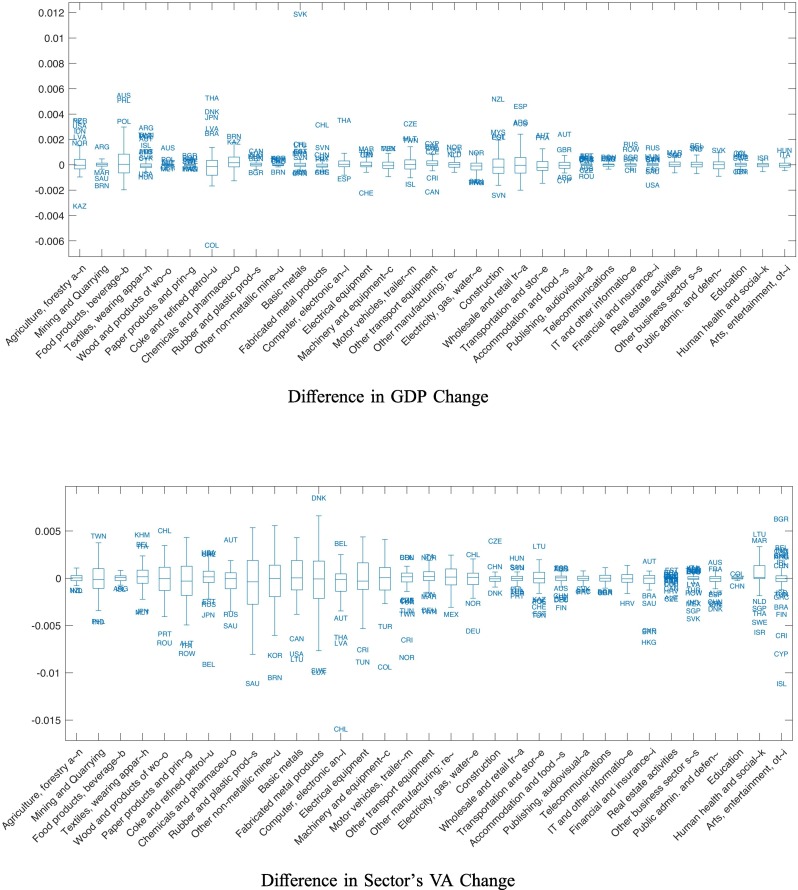
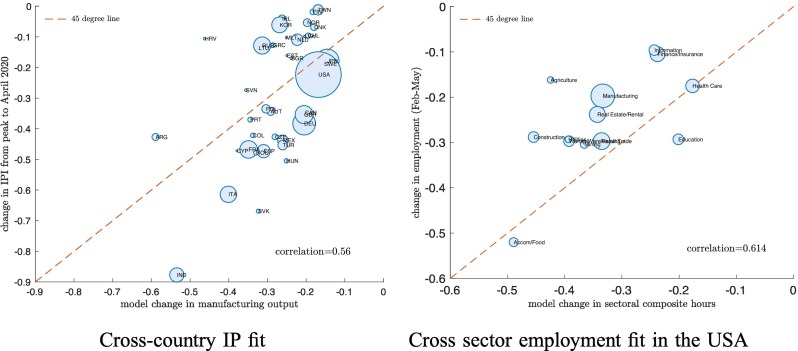
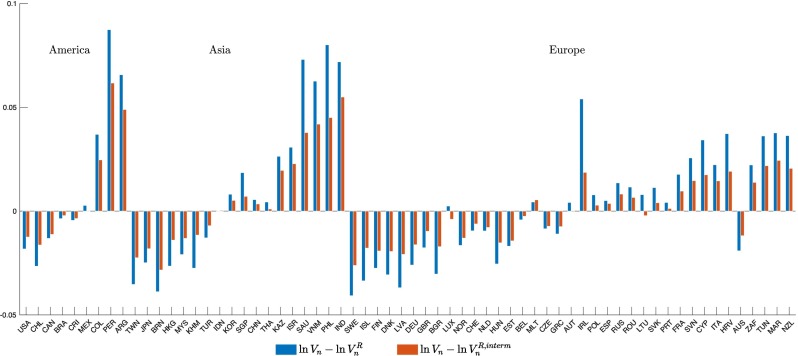
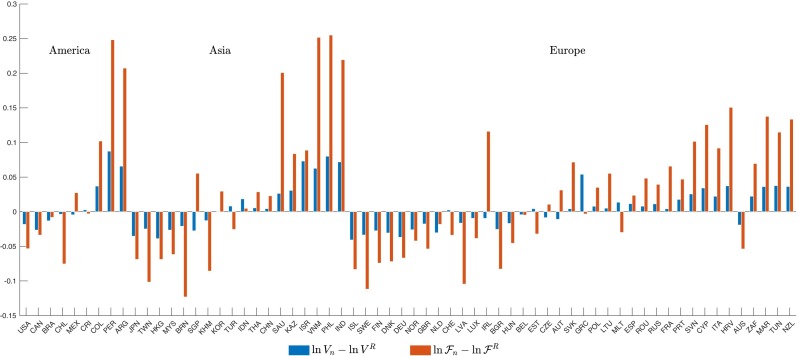
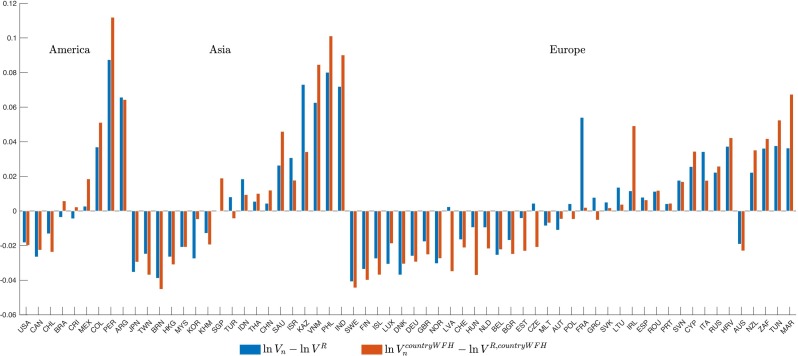
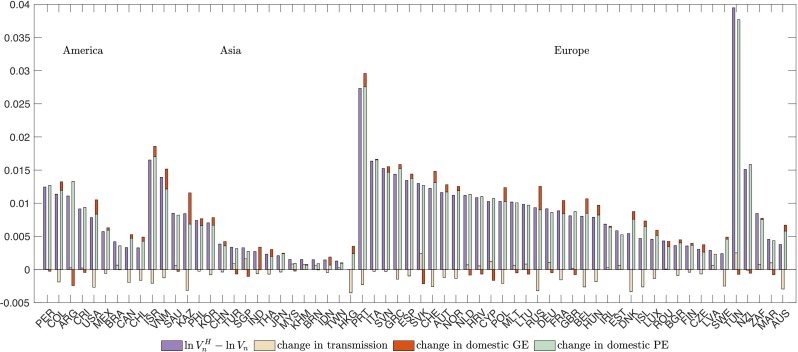
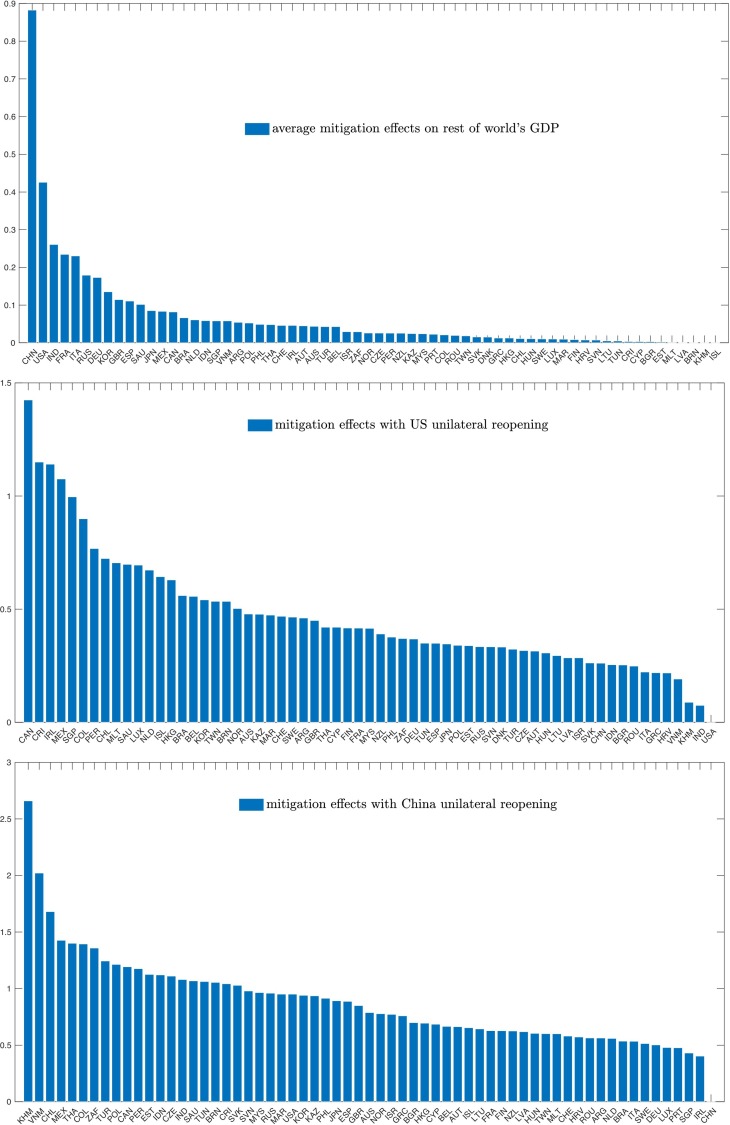
We study the role of global supply chains in the impact of the Covid-19 pandemic on GDP growth using a multi-sector quantitative framework implemented on 64 countries. We discipline the labor supply shock across sectors and countries using the fraction of work in the sector that can be done from home, interacted with the stringency with which countries imposed lockdown measures. One quarter of the total model-implied real GDP decline is due to transmission through global supply chains. However, "renationalization" of global supply chains does not in general make countries more resilient to pandemic-induced contractions in labor supply. This is because eliminating reliance on foreign inputs increases reliance on the domestic inputs, which are also disrupted due to nationwide lockdowns. In fact, trade can insulate a country imposing a stringent lockdown from the pandemic-shock, as its foreign inputs are less disrupted than its domestic ones. Finally, unilateral lifting of the lockdowns in the largest economies can contribute as much as 2.5% to GDP growth in some of their smaller trade partners.

Keywords: Covid-19; International transmission; Pandemic; Production networks.


Figures

Fig. 1
Fig. 1
Foreign Intermediate Input Use by Country and by Sector. Notes: The top panel displays the share of foreign intermediate inputs in the total intermediate purchases for the countries in our sample in 2015. The bottom panel displays the share of foreign intermediate inputs in the total sectoral intermediate purchases. The blue dashed horizontal line is the cross-sector mean. (For interpretation of the references to color in this figure legend, the reader is referred to the web version of this article.)
Fig. 2
Fig. 2
GDP Responses to the Labor Supply Shock. Notes: The top panel of this figure displays the change in GDP following the labor supply shock described in Section 3. The first bar represents the change in GDP under trade, decomposed into domestic shock (dark blue) and transmission (beige bar). The second bar represents the change in GDP under renationalization. Tables A5 and A6 in Appendix B.3 display the specific numbers. The bottom panel decomposes the change in the reaction of GDP to the labor supply shock between the baseline trade economy (ln Vn) and the renationalized supply chains economy (lnVnR), according to the decomposition in Eq. (17). The purple bar is the total difference, the beige bar is the transmission, the red bar is the change in domestic GE, and the light green bar is the change in domestic PE. (For interpretation of the references to color in this figure legend, the reader is referred to the web version of this article.)
Fig. 3
Fig. 3
Correlates of the PE and GE Effects. Notes: This figure presents scatterplots of the terms of the decomposition (17) against heuristic measures. The left panel displays the sum of the change in GE and Transmission against the country lockdown stringency. The right panel displays the change in domestic PE against the change in the country-level exposure, computed as the Domar-weighted sum of sectoral exposure in from Table A4. The lines through the data are OLS fits. The boxes report slope coefficient estimates, robust standard errors, and the R2's of the bivariate regression.
Fig. 4
Fig. 4
Sectoral Renationalization. Notes: The top panel depicts the difference in country-level GDP change due to the lockdown, between the baseline scenario and a scenario where the individual sector's supply chain is renationalized. The bottom panel depicts the difference in the sector's real value added change due to the lockdown, between the baseline scenario and a scenario where that sector's supply chain is renationalized.
Fig. 5
Fig. 5
Model fit: IP Contraction and Employment changes. Notes: This figure plots the change in April 2020 Industrial Production in the data against the fall in real manufacturing output on the y-axis in the model for 39 countries (left panel), and changes in US sectoral hours in the model against the change in US sectoral employment in the data (right panel). The lines through the data are the 45-degree lines. The model hours changes are aggregated to Bick et al. (2020)'s classification using simple averages.
Fig. 6
Fig. 6
Alternative Renationalization Scenario. Notes: This figure displays the difference in the GDP change between baseline and renationalized equilibria for alternative renationalization scenarios. The blue bars represent our main renationalization exercise (ln VR), and the red bars represent an alternative in which only intermediate trade is removed, but trade in final goods continues (ln VR,interm). (For interpretation of the references to color in this figure legend, the reader is referred to the web version of this article.)
Fig. 7
Fig. 7
Renationalization: Real Consumption vs. Real GDP. Notes: This figure displays the difference in the GDP change and in the real consumption change (lnFnlnFnR) between Trade and Renationalized Equilibria.
Fig. 8
Fig. 8
Country-Specific Work-from-Home Intensity. Notes: This figure displays the difference in the GDP change between baseline and renationalized equilibria when using country-specific measures of work-from-home intensity. The blue bars represent the baseline exercise (ln V − ln VR), and the red bars represent an alternative exercise that uses country-specific work-from-home intensity (ln VcountryWFH − ln VR,countryWFH). (For interpretation of the references to color in this figure legend, the reader is referred to the web version of this article.)
Fig. 9
Fig. 9
Difference in GDP Change between Large Health Sector Scenario and Baseline. Notes. This figure displays the decomposition (17) of the GDP contraction difference between the high-health scenario (lnVnH) and the baseline (ln Vn). The blue bar is the total difference, the beige bar is the difference in transmission, the red bar is the difference in the change in domestic GE, and the light green bar is the difference in the change in domestic PE. (For interpretation of the references to color in this figure legend, the reader is referred to the web version of this article.)
Fig. 10
Fig. 10
GDP Changes due to Unilateral Reopening. Notes: The top panel displays the GDP change in the rest of the world, when the country on the x-axis lifts its lockdown. The middle panel displays the GDP change of the country on the x-axis when the US lifts its lockdown. The bottom panel displays the GDP change of the country on the x-axis when China lifts its lockdown.

References

    1. Acemoglu D., Chernozhukov V., Werning I., Whinston M.D. National Bureau of Economic Research; 2020. A Multi-Risk SIR Model With Optimally Targeted Lockdown. Working Paper 27102.
    1. Allen T., Arkolakis C., Takahashi Y. Universal gravity. J. Polit. Econ. 2020;128(2):393–433.
    1. Alon T., Kim M., Lagakos D., VanVuren M. National Bureau of Economic Research; 2020. How Should Policy Responses to the COVID-19 Pandemic Differ in the Developing World? Working Paper 27273.
    1. Antràs P., Redding S.J., Rossi-Hansberg E. National Bureau of Economic Research; 2020. Globalization and Pandemics, Working Paper 27840.
    1. Atalay E. How important are sectoral shocks? Am. Econ. J.: Macroecon. 2017;9(4):254–280.

LinkOut - more resources