

Impacts of COVID-19 local spread and Google search trend on the US stock market
- PMID: 34866767
- PMCID: PMC8629345
- DOI: 10.1016/j.physa.2021.126423
Impacts of COVID-19 local spread and Google search trend on the US stock market
Abstract
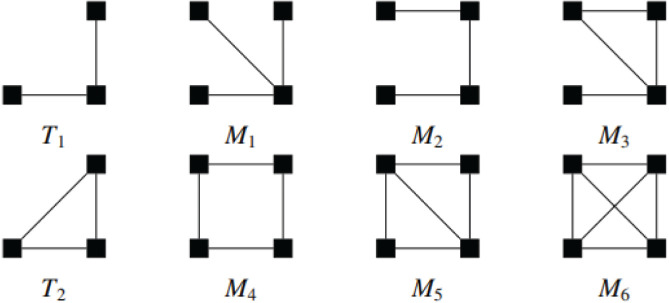
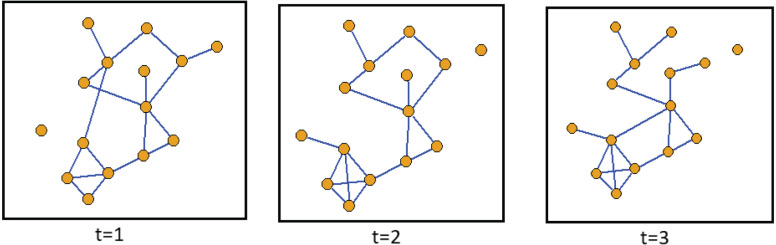
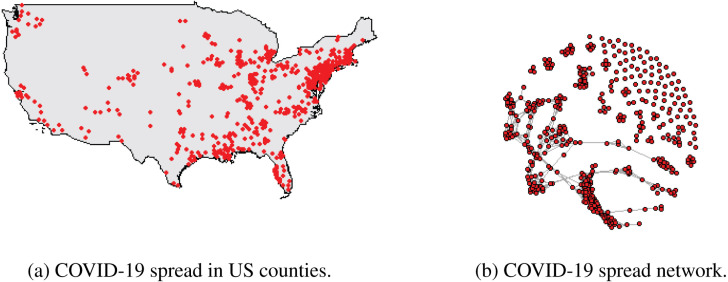
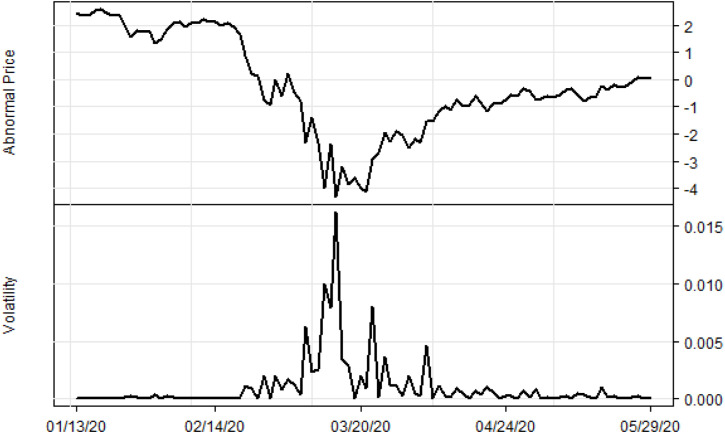
We develop a novel temporal complex network approach to quantify the US county level spread dynamics of COVID-19. We use both conventional econometric and Machine Learning (ML) models that incorporate the local spread dynamics, COVID-19 cases and death, and Google search activities to assess if incorporating information about local spreads improves the predictive accuracy of models for the US stock market. The results suggest that COVID-19 cases and deaths, its local spread, and Google searches have impacts on abnormal stock prices between January 2020 to May 2020. Furthermore, incorporating information about local spread significantly improves the performance of forecasting models of the abnormal stock prices at longer forecasting horizons.
Keywords: Abnormal price; Causality; Covid-19; Stock market; Temporal network; Volatility.
© 2021 Published by Elsevier B.V.
Conflict of interest statement
The authors declare that they have no known competing financial interests or personal relationships that could have appeared to influence the work reported in this paper.
Figures


References
-
- Cagle J.A. Natural disasters, insurer stock prices, and market discrimination: The case of hurricane hugo. J. Insur. Issues. 1996;19(1):53–68.
-
- E. Cavallo, I. Noy, The Economics of Natural Disasters - A Survey, Working Papers 200919, University of Hawaii at Manoa, Department of Economics, 2009.
-
- Worthington A., Valadkhani A. Measuring the impact of natural disasters on capital markets: an empirical application using intervention analysis. Appl. Econ. 2004;36(19):2177–2186. doi: 10.1080/0003684042000282489. - DOI
-
- Worthington A.C. The impact of natural events and disasters on the Australian stock market: a GARCH-m analysis of storms, floods, cyclones, earthquakes and bushfires. Glob. Bus. Econ. Rev. 2008;10:1–10.
-
- Shan L., Gong S.X. Investor sentiment and stock returns: Wenchuan Earthquake. Finance Res. Lett. 2012;9(1):36–47.
LinkOut - more resources
Full Text Sources