

Comparison of Different Tissue Clearing Methods for Three-Dimensional Reconstruction of Human Brain Cellular Anatomy Using Advanced Imaging Techniques
- PMID: 34867215
- PMCID: PMC8632656
- DOI: 10.3389/fnana.2021.752234
Comparison of Different Tissue Clearing Methods for Three-Dimensional Reconstruction of Human Brain Cellular Anatomy Using Advanced Imaging Techniques
Abstract
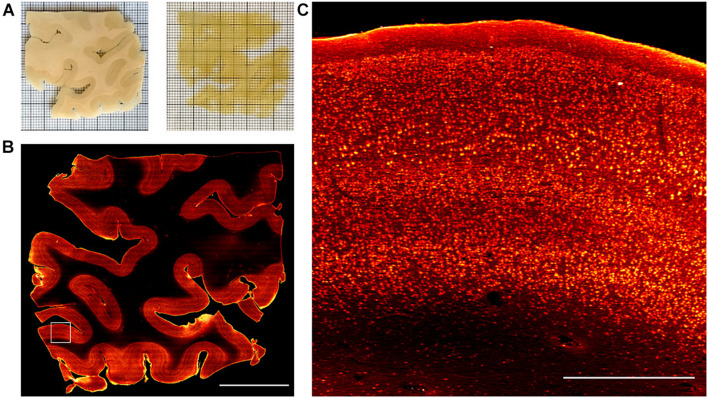
The combination of tissue clearing techniques with advanced optical microscopy facilitates the achievement of three-dimensional (3D) reconstruction of macroscopic specimens at high resolution. Whole mouse organs or even bodies have been analyzed, while the reconstruction of the human nervous system remains a challenge. Although several tissue protocols have been proposed, the high autofluorescence and variable post-mortem conditions of human specimens negatively affect the quality of the images in terms of achievable transparency and staining contrast. Moreover, homogeneous staining of high-density epitopes, such as neuronal nuclear antigen (NeuN), creates an additional challenge. Here, we evaluated different tissue transformation approaches to find the best solution to uniformly clear and label all neurons in the human cerebral cortex using anti-NeuN antibodies in combination with confocal and light-sheet fluorescence microscopy (LSFM). Finally, we performed mesoscopic high-resolution 3D reconstruction of the successfully clarified and stained samples with LSFM.
Keywords: clearing techniques; expansion microscopy; immunofluorescence; light-sheet fluorescence microscopy; optical microscopy.
Copyright © 2021 Scardigli, Pesce, Brady, Mazzamuto, Gavryusev, Silvestri, Hof, Destrieux, Costantini and Pavone.
Conflict of interest statement
The authors declare that the research was conducted in the absence of any commercial or financial relationships that could be construed as a potential conflict of interest.
Figures


Similar articles
-
Optical Clearing and Labeling for Light-sheet Fluorescence Microscopy in Large-scale Human Brain Imaging.J Vis Exp. 2024 Jan 26;(203). doi: 10.3791/65960. J Vis Exp. 2024. PMID: 38345230
-
Imaging the mammary gland and mammary tumours in 3D: optical tissue clearing and immunofluorescence methods.Breast Cancer Res. 2016 Dec 13;18(1):127. doi: 10.1186/s13058-016-0754-9. Breast Cancer Res. 2016. PMID: 27964754 Free PMC article.
-
Multiresolution 3D Optical Mapping of Immune Cell Infiltrates in Mouse Asthmatic Lung.Am J Respir Cell Mol Biol. 2023 Jul;69(1):13-21. doi: 10.1165/rcmb.2022-0353MA. Am J Respir Cell Mol Biol. 2023. PMID: 37017484 Free PMC article.
-
Deep tissue imaging: a review from a preclinical cancer research perspective.Histochem Cell Biol. 2016 Dec;146(6):781-806. doi: 10.1007/s00418-016-1495-7. Epub 2016 Oct 4. Histochem Cell Biol. 2016. PMID: 27704211 Review.
-
Innovations in ex vivo Light Sheet Fluorescence Microscopy.Prog Biophys Mol Biol. 2022 Jan;168:37-51. doi: 10.1016/j.pbiomolbio.2021.07.002. Epub 2021 Jul 19. Prog Biophys Mol Biol. 2022. PMID: 34293338 Review.
Cited by
-
A Guide to Perform 3D Histology of Biological Tissues with Fluorescence Microscopy.Int J Mol Sci. 2023 Apr 4;24(7):6747. doi: 10.3390/ijms24076747. Int J Mol Sci. 2023. PMID: 37047724 Free PMC article. Review.
-
INSIHGT: an accessible multi-scale, multi-modal 3D spatial biology platform.Nat Commun. 2024 Dec 30;15(1):10888. doi: 10.1038/s41467-024-55248-0. Nat Commun. 2024. PMID: 39738072 Free PMC article.
-
3D molecular phenotyping of cleared human brain tissues with light-sheet fluorescence microscopy.Commun Biol. 2022 May 12;5(1):447. doi: 10.1038/s42003-022-03390-0. Commun Biol. 2022. PMID: 35551498 Free PMC article.
-
A cellular resolution atlas of Broca's area.Sci Adv. 2023 Oct 13;9(41):eadg3844. doi: 10.1126/sciadv.adg3844. Epub 2023 Oct 12. Sci Adv. 2023. PMID: 37824623 Free PMC article.
-
Tissue libraries enable rapid determination of conditions that preserve antibody labeling in cleared mouse and human tissue.Elife. 2023 Jan 19;12:e84112. doi: 10.7554/eLife.84112. Elife. 2023. PMID: 36656755 Free PMC article.
References
Grants and funding
LinkOut - more resources
Full Text Sources