. 2021 Nov 15:12:725084.
doi: 10.3389/fphar.2021.725084. eCollection 2021.

Granulocyte Colony-Stimulating Factor Treatment Before Radiotherapy Protects Against Radiation-Induced Liver Disease in Mice

Affiliations

Granulocyte Colony-Stimulating Factor Treatment Before Radiotherapy Protects Against Radiation-Induced Liver Disease in Mice

Isalira Peroba Rezende Ramos et al. Front Pharmacol. .

Abstract

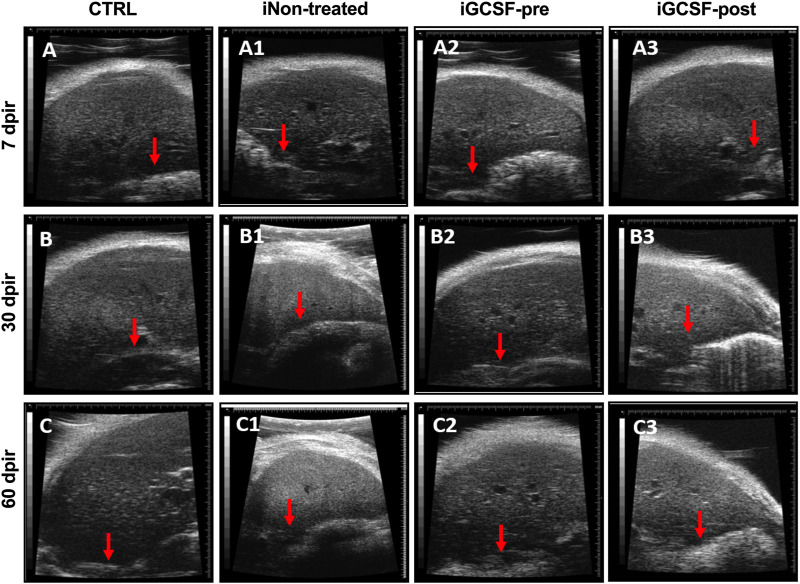
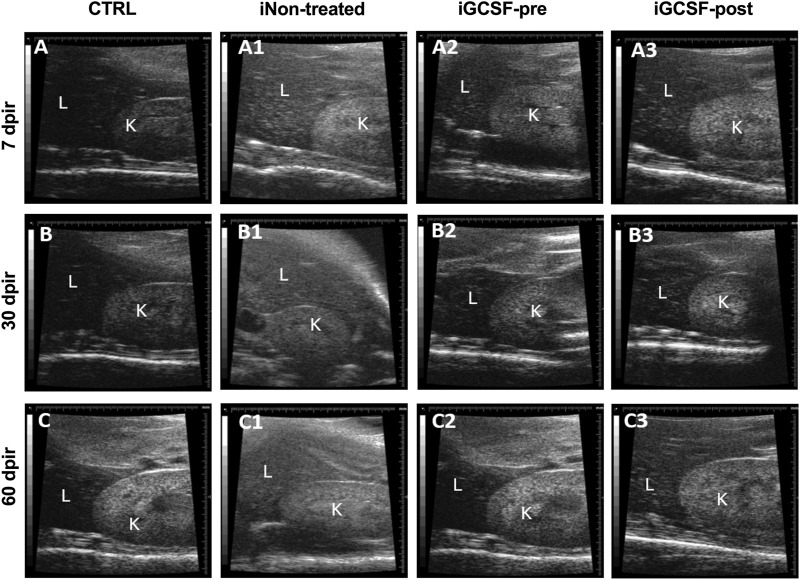
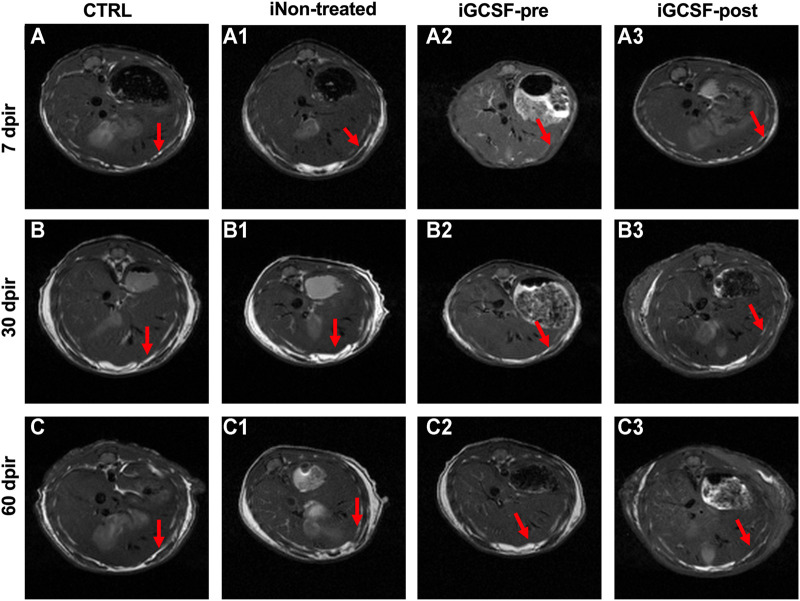
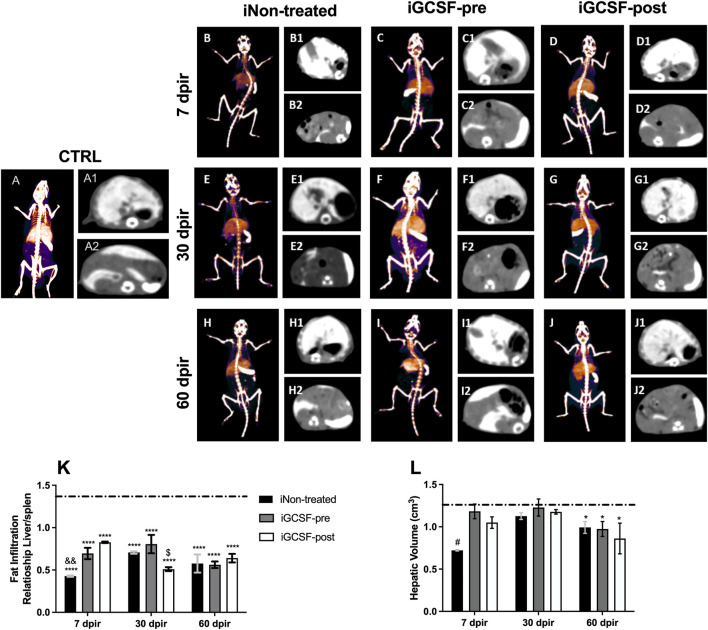
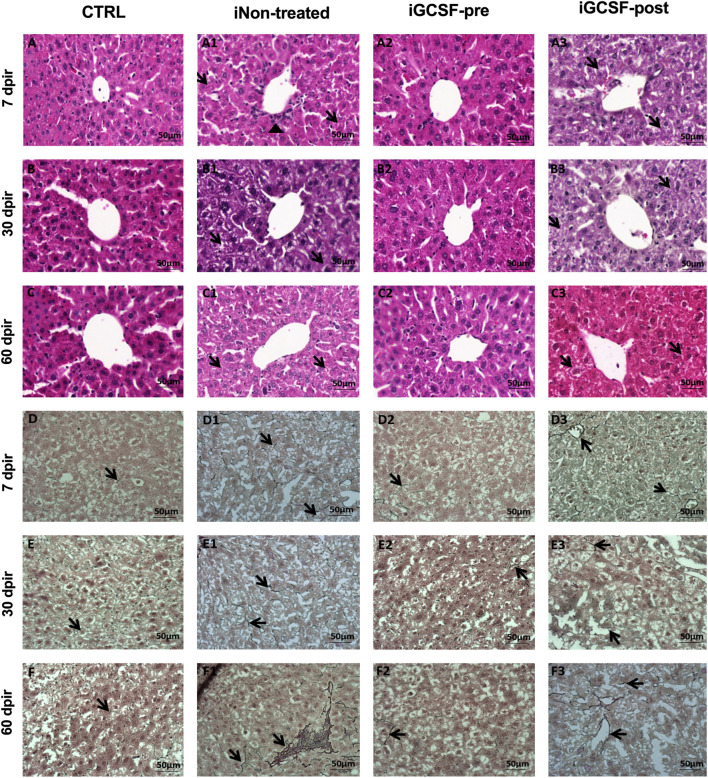
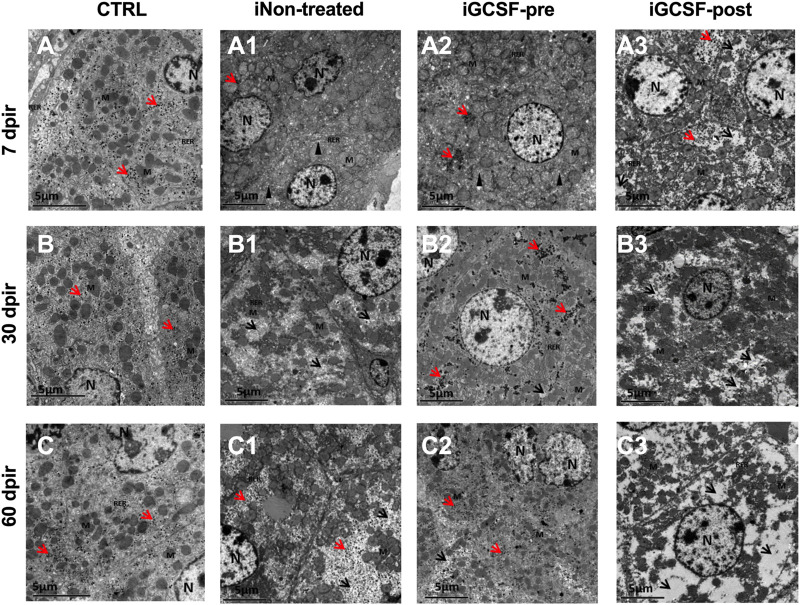
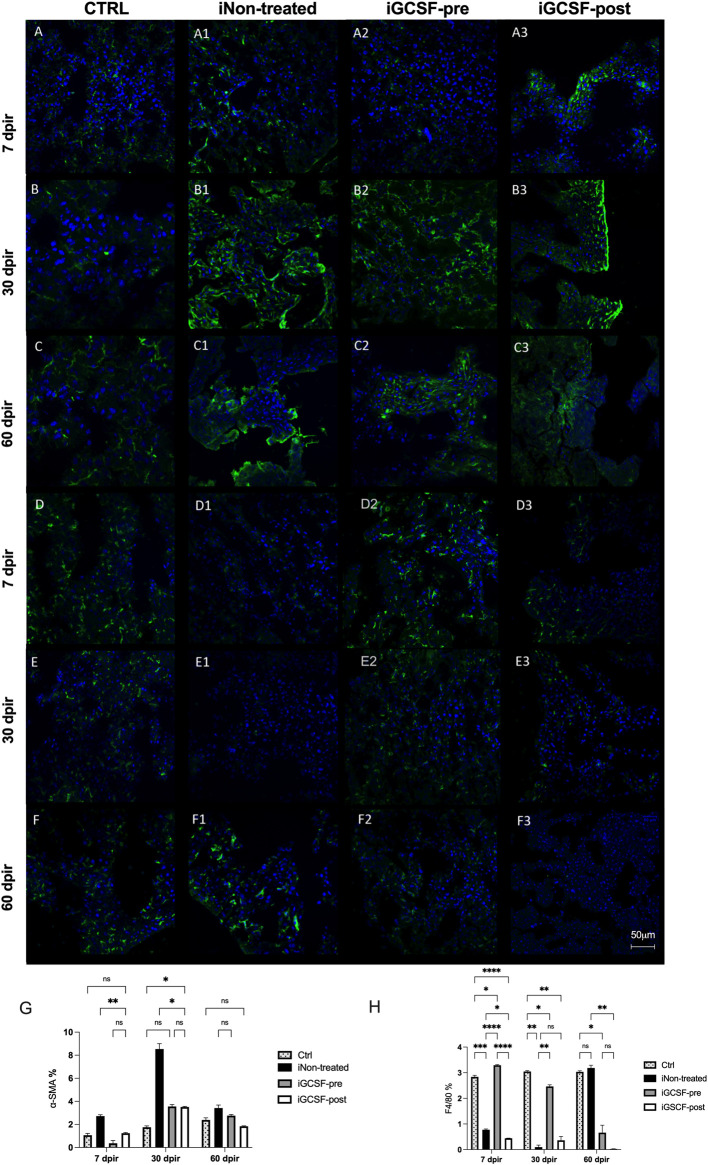
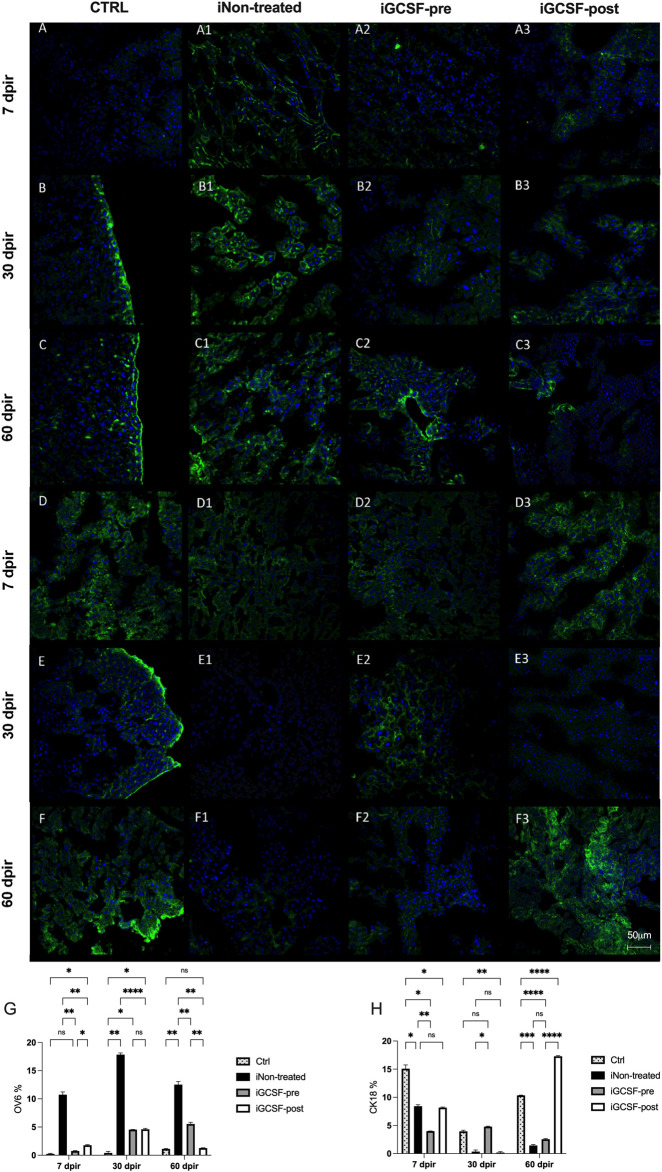
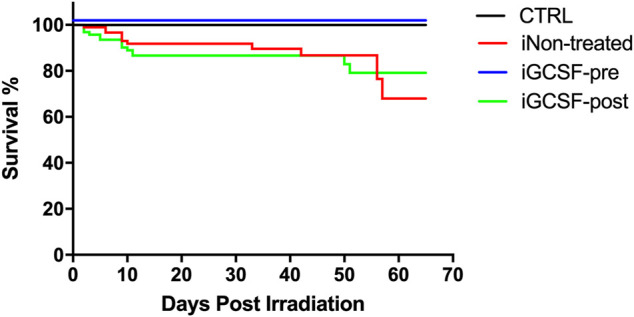
Radiation-induced liver disease (RILD) remains a major problem resulting from radiotherapy. In this scenario, immunotherapy with granulocyte colony-stimulating factor (G-CSF) arises as an attractive approach that might improve the injured liver. Here, we investigated G-CSF administration's impact before and after liver irradiation exposure using an association of alcohol consumption and local irradiation to induce liver disease model in C57BL/6 mice. Male and female mice were submitted to a previous alcohol-induced liver injury protocol with water containing 5% alcohol for 90 days. Then, the animals were treated with G-CSF (100 μg/kg/d) for 3 days before or after liver irradiation (18 Gy). At days 7, 30, and 60 post-radiation, non-invasive liver images were acquired by ultrasonography, magnetic resonance, and computed tomography. Biochemical and histological evaluations were performed to verify whether G-CSF could prevent liver tissue damage or reverse the acute liver injury. Our data showed that the treatment with G-CSF before irradiation effectively improved morphofunctional parameters caused by RILD, restoring histological arrangement, promoting liver regeneration, preserving normal organelles distribution, and glycogen granules. The amount of OV-6 and F4/80-positive cells increased, and α-SMA positive cells' presence was normalized. Additionally, prior G-CSF administration preserved serum biochemical parameters and increased the survival rates (100%). On the other hand, after irradiation, the treatment showed a slight improvement in survival rates (79%) and did not ameliorate RILD. Overall, our data suggest that G-CSF administration before radiation might be an immunotherapeutic alternative to radiotherapy planning to avoid RILD.

Keywords: G-CSF; alcohol; computed tomography; immunotherapy; irradiation; liver; magnetic resonance imaging; ultrasonography.


Conflict of interest statement

The authors declare that the research was conducted in the absence of any commercial or financial relationships that could be construed as a potential conflict of interest.

Figures

FIGURE 1
FIGURE 1
Blood markers of liver function and injury before and after G-CSF treatment. Serum albumin (ALB) levels measured on experimental days 7, 30, and 60 in iNon-treated Group, iGCSF-pre and, iGCSF-post group (A). Serum alanine aminotransferase (ALT) levels measured on experimental days 7, 30 and, 60 in iNon-treated Group, iGCSF-pre and, iGCSF-post group (B). Multiple comparisons using two-way analysis of variance (ANOVA) followed by Tukey’s test were used. Data are represented as means ± SEM, p < 0.05 was considered significant, where *p < 0.05; **p < 0.01 and ***p < 0.001) (n = 10 per Group).
FIGURE 2
FIGURE 2
Liver ultrasound findings. Ultrasound images obtained from CTRL (A–C), iNon-treated (A1–C1), iGCSF-pre (A2–C2) and, iGCSF-post group (A3–C3) at 7, 30- and 60-days post-irradiation. Images obtained from a healthy animal show normal liver echogenicity and a homogeneous, smooth and, regular surface (indicated by red arrow) (A–C). iNon-treated group images (A1–C1) showed liver parenchyma with finely and slightly heterogeneous and increased echogenicity. Besides, a lobulated liver surface was too observed (indicated by red arrow). Similarities were observed in animals of the iGCSF-pre Group in 30 (B2) and 60 dpir (C2) and all animals in the iGCSF-post Group (A3–C3). Images obtained from iGCSF-pre in 7 dpir (A2) revealed similarities with CTRL group, maintaining its homogeneous echogenicity and regular surface (n = 8 per Group).
FIGURE 3
FIGURE 3
Hepatorenal ultrasound findings. Ultrasound images obtained from CTRL (A–C), iNon-treated (A1–C1), iGCSF-pre (A2–C2) and, iGCSF-post group (A3–C3) at 7, 30- and 60-day post-irradiation. Images obtained from CTRL group (A–C) and iGCSF-pre Group (A2–C2) showed that the liver (L) was less echogenic than the kidney (K). Echogenicity similarities between liver and kidney were observed in 7 dpir (A1). Changes in hepatorenal echogenicity were observed in 60 dpir in iGCSF-post, where the liver was hyperechogenic concerning the renal parenchyma (n = 8 per Group).
FIGURE 4
FIGURE 4
Magnetic resonance image findings. MRI images obtained from CTRL (A–C), iNon-treated (A1–C1), iGCSF-pre (A2–C2) and, iGCSF-post Group (A3–C3) at 7, 30- and 60-day post-irradiation. Images obtained from CTRL Group (A–C) revealed liver parenchyma with diffusely homogeneous signal intensity and regular contours (indicated by arrows). Irregular contours (indicated by arrows) were observed in iNon-treated (A1–C1) and, iGCSF-post Groups. In the iGCSF-pre Group, MR images suggest that the signal intensity was lower than in iNon-treated and iGCSF-post Groups, but it also showed irregular contours (indicated by arrows) (Panels A2–C2). All images were acquired before gadolinium intraperitoneal injection (n = 10 per Group).
FIGURE 5
FIGURE 5
Assessment of liver volume and fat infiltration by computed tomography. Computed tomography 48 h after intravenous administration of EXITRON NANO 12000 contrast. CTRL-3D volumetric reconstruction (A), axial slice showing contrast enhancement by the Liver (A1) and Spleen (A2) at a control animal. iNon-treated-3D volumetric reconstruction 7 (B), 30 (E), and 60 (H) dpir, axial slice showing contrast enhancement by the Liver and Spleen 7, 30 and 60 dpir (B1,B2, E1,E2, H1,H2). iGCSF-pre—3D volumetric reconstruction 7 (C), 30 (F) and 60 (I) dpir, axial slice showing contrast enhancement by the Liver and Spleen 7, 30 and 60 dpir (C1,C2, F1,F2, I1,I2). iGCSF-post—3D volumetric reconstruction 7 (D), 30 (G) and 60 (J) dpir, axial slice showing contrast enhancement by the Liver and Spleen 7, 30 and 60 dpir (D1,D2, G1,G2, J1,J2). (K) Liver/Spleen ratio among the three groups showing that at 7 dpir iNon-treated group was classified as having severe infiltration, while the groups treated with G-CSF had mild steatosis. At 30 dpir, the iNon-treated Group showed moderate fatty infiltration, the iNon-treated + iGCSF-pre-group light infiltration, and the iNon-treated + iGCSF-post Group had severe steatosis. At 60 dpir, all groups were classified as moderate fatty liver infiltration. (L) There is a volumetric reduction of the liver in the iNon-treated and iGCSF-post groups in relation to the control group (dotted line) in all evaluation stages. Multiple comparisons using one-way analysis of variance (ANOVA) were used. Data are represented as means ± SEM (n = 5 per Group). p < 0.05 was considered significant, where *p < 0.05; ****p < 0.0001.
FIGURE 6
FIGURE 6
Histopathological assessment of liver tissue. Representative images stained with hematoxylin and eosin (H&E) and reticulin of CTRL (A–C; D–F), iNon-treated (A1–C1,D1–F1), iGCSF-pre (A2–C2,D2–F2) and iGCSF-post group (A3-C3; D3-F3) at 7, 30- and 60-day post-irradiation. CTRL Group (A–C) H&E-stained sections revealed liver parenchyma with a radial distribution of hepatocytes around the vessels and homogeneous distribution of cytoplasm. In the iNon-treated Group, in 7 dpir (A1) the loss of the radial distribution of hepatocytes, beginning cytoplasm vacuolization (indicated by arrows) and polymorphonuclear infiltrate (indicated by arrowhead) was observed. At 30 dpir (B1), most hepatocytes had vacuolization of the cytoplasm and did not show radial distribution around the vessel. At 60 dpir (C1) radial distribution was observed, but hepatocytes showed vacuolated cytoplasm (indicated by arrows). A preserved liver parenchyma with a radial distribution of hepatocytes and absence of cytoplasmic vacuolization (indicated by arrows) of hepatocytes were observed in iGCSF-pre (A2–C2) group at 7, 30 and, 60 dpir. In the iGCSF-post (A3–C3) group, hepatocytes showed vacuolated cytoplasm (arrows) and loss of radial distribution around the vessel at all times analyzed. (n = 8 per group). In liver tissue impregnated with silver (Reticulin) histological sections, the CTRL group (D–F) showed the presence of few reticulin fibers (indicated by arrows). iNon-treated group images (D1–F1) showed an increase in these reticulin fibers (arrows) from 7 dpir (D1) to 60 dpir (F1). In the iGCSF-pre Group (D2–F2) it was observed that the tissue had fewer reticular fibers (arrows) than the iNon-treated Group, but more fibers (arrows) were found than in the CTRL group. In the iGCSF-post Group (D–D2), there was also an increase in fibers (indicated by arrows) concerning CTRL (n = 8 per Group). Scale bars: 50 µm.
FIGURE 7
FIGURE 7
Electron micrographs representative of transmission electron microscopy analysis (TEM). TEM images of CTRL group (A–C) showed well-condensed cytoplasm with several organelles, well-preserved mitochondria, rough endoplasmic reticulum, and distributed glycogen granules. iNon-treated Group (A1–C1) in 7 dpir (A1) showed more evident smooth endoplasmic reticulum (SER) cisterns, ruptured mitochondria, and loss of ridges, in addition to the rarer cytoplasm. At 30 (B1) and 60 (C1) dpir, a rarer cytoplasm was observed with an absence of organelles, mitochondria with rupture of the outer membrane, absence of mitochondrial ridges, and reduction of glycogen granules. In the iGCSF-pre (A2–C2) group, with 7 dpir (A2), well-condensed cytoplasm was observed with preserved mitochondria, RER, glycogen granules, similar to the CTRL group, but with more evident SER cisterns. With 30 (B2) and 60 dpir (C2), a large amount of glycogen granules, reduction of the cisterns of SER, few regions of rarefied cytoplasm and well-preserved mitochondria were observed. In the iGCSF-post Group (A3–C3), at all times analyzed, rarefied cytoplasm, degraded, ruptured, and crested mitochondria, fragmented RER, and presence of glycogen granules were only observed in 7 dpir (A3). N, nuclei; M, Mitochondria; RER, rough endoplasmic reticulum; SER: smooth endoplasmic reticulum; Arrowhead, dilated smooth endoplasmic reticulum cistern; Red arrow, glycogen granules; Black arrowhead, rarefied cytoplasm. (n = 5 per group). Scale bars: 5 µm.
FIGURE 8
FIGURE 8
Liver tissue α-SMA and F4/80 protein expression evaluation. Representative images of α-SMA and F4/80 immunostaining from CTRL (A–C,D–F), iNon-treated (A1–C1,D1–F1), iGCSF-pre (A2–C2,D2–F2) and, iGCSF-post group (A3–C3,D3–F3) at 7, 30- and 60-day post-irradiation. Immunostaining images revealed positive cells for α-SMA with normal distribution and an increase in the α-SMA protein expression starting from 7 dpir (A), which gradually increased to 60 dpir (B–C) at CTRL group. In the iGCSF-pre (A2–C2) group, this increase was observed in 30 dpir (B2), decreasing slightly by 60 dpir (C2). In the iGCSF-post Group (A3–C3), this increase started at 7 dpir (A3) and continued to increase significantly at 30 and 60 dpir (B3–C3). On the other hand, in the iNon-treated Group an increase was observed in 30 dpir (B1) and a slight decrease was observed in the iNon-treated Group (C1) at 60 dpir. Immunostaining images revealed F4/80 protein expression in the CTRL group (D–F). In comparison to control, F4/80 protein expression was reduced in iNon-treated animals (D1–F1) in both 7 and 30 dpir (D1–E1), but in 60 dpir (F1) the expression increased slightly, while in the group iGCSF-pre (A2–F2) this recruitment was increased since 7 dpir (A2) and was maintained until 60 dpir (F2). A decrease in F4/80 protein expression was observed in 7, 30 and, 60 dpir in iGCSF-post (D3–F3) group. Quantification of cells expressing α-SMA (G) and F4/80 (H) in each group. The results are represented in mean ± sem. All groups were compared using Two-way analysis of variance followed by Tukey test, where *p < 0.05; **p < 0.01; ***p < 0.001 and ****p < 0.0001. Scale bars: 50 µm. Green = α-actin and F4/80, respectively, blue = DAPI (nuclei); (n = 5 per group).
FIGURE 9
FIGURE 9
Liver stem cell (OV-6) and cytokeratin-18 (CK18) protein expression evaluation. Representative images of OV-6 and CK-18 immunostaining from CTRL (A–C,D–F), iNon-treated (A1–C1,D1–F1), iGCSF-pre (A2–C2,D2–F2) and iGCSF-post group (A3–C3,D3–F3) at 7, 30- and 60-day post-irradiation. Immunostaining images revealed low OV-6 protein expression in CTRL group (A–C). In iNon-treated Group (A1–C1), an increase in OV-6 protein expression was observed at all analyzed times. In iGCSF-pre Group (A2–C2), a remarkable increase in OV-6 protein expression was observed. Similarities regarding OV-6 protein expression between iGCSF-post Group (A3–C3) and iNon-treated animals were identified. Immunostaining images revealed a normal CK-18 protein expression distribution in CTRL group (D–F). In comparison to the control group, a decrease in CK-18 protein expression was observed from 30 dpir (E1), which remained until 60 dpir (F1) in the iNon-treated Group. Immunoreactivity similar to the control was observed between groups iGCSF-pre (D2–F2) and iGCSF-post (D3–F3) groups. A remarkable increase in CK-18 protein expression was observed in iGCSF-pre Group in 30 (E2) and 60 dpir (F2) in comparison to iGCSF-post Group (E3–F3). Quantification of Liver stem cell (OV-6) (G) and cytokeratin-18 (CK18) (H) in each group. The results are represented in mean ± sem. All groups were compared using Two-way analysis of variance followed by Tukey test, where *p < 0.05; **p < 0.01; ***p < 0.001 and ****p < 0.0001. Scale bars: 50 µm. Green = OV-6 and CK-18, respectively, blue = DAPI (nuclei); (n = 5 per group).
FIGURE 10
FIGURE 10
Survival analysis. Kaplan–Meier curves of survival for 60-day post-irradiation in the CTRL, iNon-treated, iGCSF-pre and iGCSF-post Group (n = 20 per Group). The survival is statistically significant in a log-rank (Mantel-Cox) test, where the comparison of all survival curves ****p < 0.0001; iGCSF-pre vs. iGCSF-post ***p = 0.0002; iGCSF-pre vs. iNon-treated ***p = 0.0005 and iGCSF-post vs. iNon-treated p = 0.6929.

Similar articles

Cited by

References

    1. Awan S. J., Baig M. T., Yaqub F., Tayyeb A., Ali G. (2017). In Vitro Differentiated Hepatic Oval-Like Cells Enhance Hepatic Regeneration in CCl4 -Induced Hepatic Injury. Cell Biol Int 41 (1), 51–61. 10.1002/cbin.10699 - DOI - PubMed
    1. Benderitter M., Caviggioli F., Chapel A., Coppes R. P., Guha C., Klinger M., et al. (2014). Stem Cell Therapies for the Treatment of Radiation-Induced normal Tissue Side Effects. Antioxid. Redox Signal. 21 (2), 338–355. 10.1089/ars.2013.5652 - DOI - PMC - PubMed
    1. Bentzen S. M. (2006). Preventing or Reducing Late Side Effects of Radiation Therapy: Radiobiology Meets Molecular Pathology. Nat. Rev. Cancer 6 (9), 702–713. 10.1038/nrc1950 - DOI - PubMed
    1. Boneberg E. M., Hartung T. (2002). Molecular Aspects of Anti-Inflammatory Action of G-CSF. Inflamm. Res. 51 (3), 119–128. 10.1007/pl00000283 - DOI - PubMed
    1. Carvalho A. B., Quintanilha L. F., Dias J. V., Paredes B. D., Mannheimer E. G., Carvalho F. G., et al. (2008). Bone Marrow Multipotent Mesenchymal Stromal Cells Do Not Reduce Fibrosis or Improve Function in a Rat Model of Severe Chronic Liver Injury. Stem Cells 26 (5), 1307–1314. 10.1634/stemcells.2007-0941 - DOI - PubMed

LinkOut - more resources