

Post-weaning Social Isolated Flinders Sensitive Line Rats Display Bio-Behavioural Manifestations Resistant to Fluoxetine: A Model of Treatment-Resistant Depression
- PMID: 34867504
- PMCID: PMC8635751
- DOI: 10.3389/fpsyt.2021.688150
Post-weaning Social Isolated Flinders Sensitive Line Rats Display Bio-Behavioural Manifestations Resistant to Fluoxetine: A Model of Treatment-Resistant Depression
Abstract
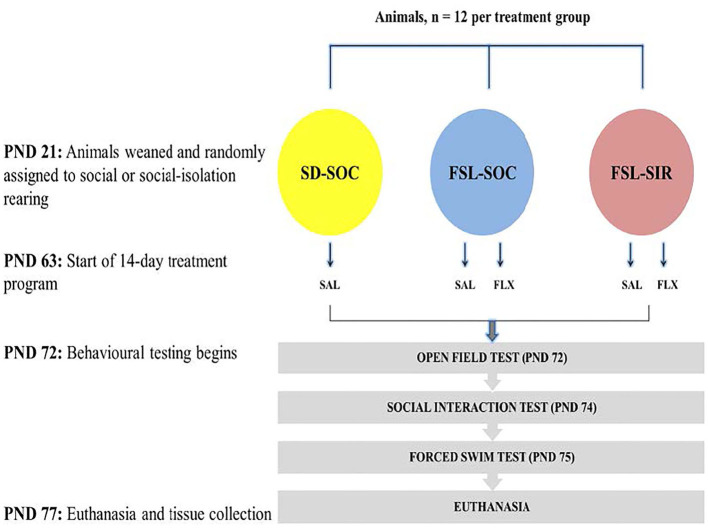
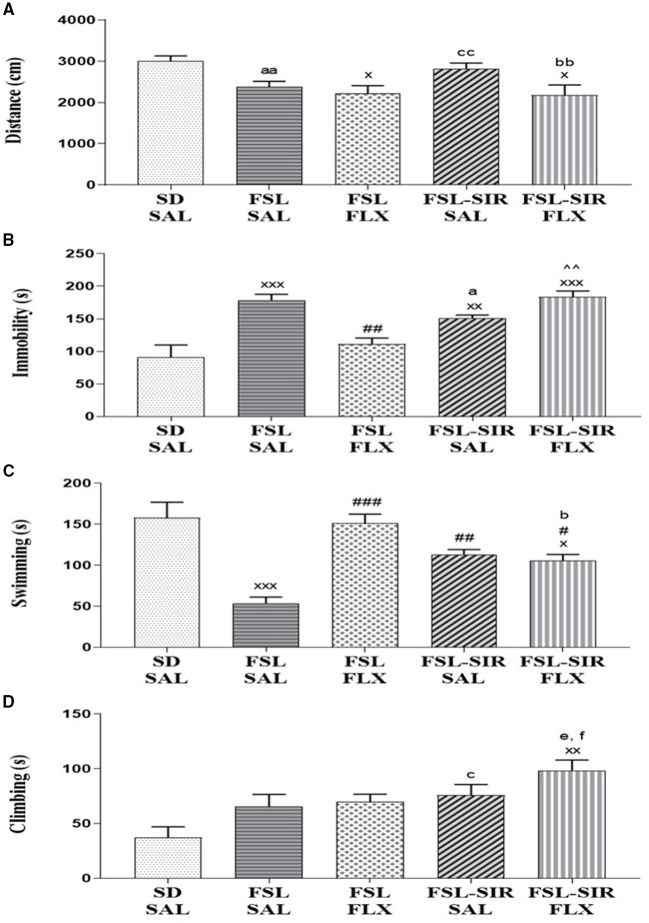
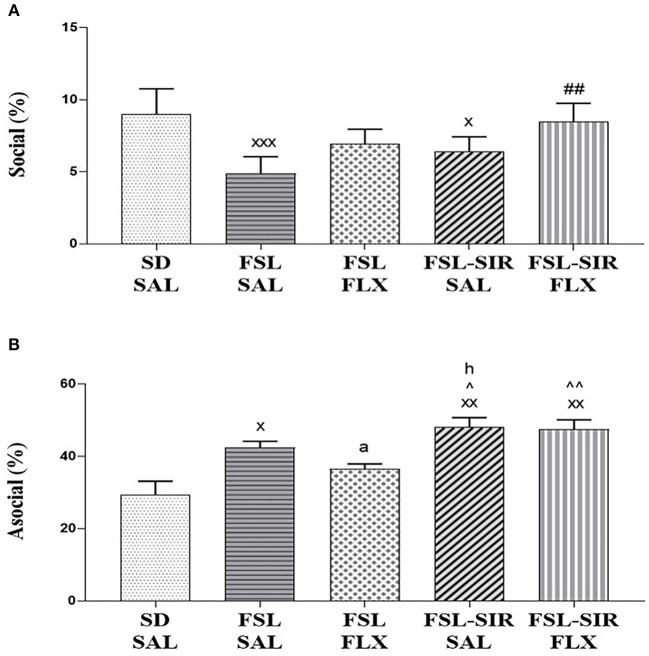
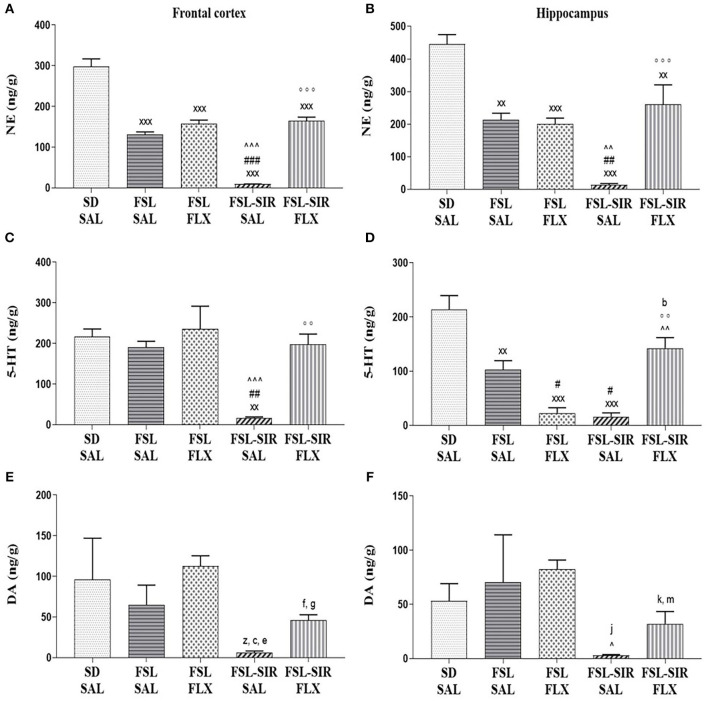
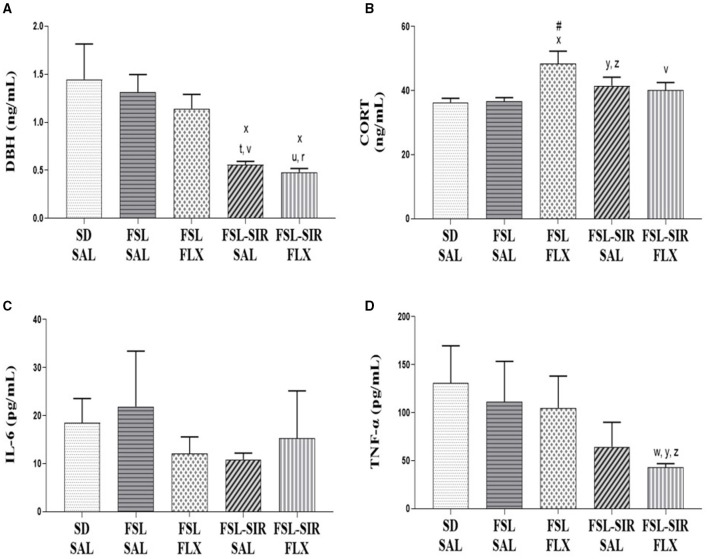
Treatment-resistant depression (TRD) complicates the management of major depression (MD). The underlying biology of TRD involves interplay between genetic propensity and chronic and/or early life adversity. By combining a genetic animal model of MD and post-weaning social isolation rearing (SIR), we sought to produce an animal that displays more severe depressive- and social anxiety-like manifestations resistant to standard antidepressant treatment. Flinders Sensitive Line (FSL) pups were social or isolation reared from weaning [postnatal day (PND) 21], receiving fluoxetine (FLX) from PND 63 (10 mg/kg × 14 days), and compared to Sprague Dawley (SD) controls. Depressive-, anxiety-like, and social behaviour were assessed from PND 72 in the forced swim test (FST) and social interaction test (SIT). Post-mortem cortico-hippocampal norepinephrine (NE), serotonin (5-HT), and dopamine (DA), as well as plasma interleukin 6 (IL-6), tumour necrosis factor alpha (TNF-α), corticosterone (CORT), and dopamine-beta-hydroxylase (DBH) levels were assayed. FSL rats displayed significant cortico-hippocampal monoamine disturbances, and depressive- and social anxiety-like behaviour, the latter two reversed by FLX. SIR-exposed FSL rats exhibited significant immobility in the FST and social impairment which were, respectively, worsened by or resistant to FLX. In SIR-exposed FSL rats, FLX significantly raised depleted NE and 5-HT, significantly decreased DBH and caused a large effect size increase in DA and decrease in CORT and TNF-α. Concluding, SIR-exposed FSL rats display depressive- and social anxiety-like symptoms that are resistant to, or worsened by, FLX, with reduced plasma DBH and suppressed cortico-hippocampal 5-HT, NE and DA, all variably altered by FLX. Exposure of a genetic animal model of MD to post-weaning SIR results in a more intractable depressive-like phenotype as well as changes in TRD-related biomarkers, that are resistant to traditional antidepressant treatment. Given the relative absence of validated animal models of TRD, these findings are especially promising and warrant study, especially further predictive validation.
Keywords: bipolar disorder; gene-environment model; inflammation; monoamines; risk and resilience; social anxiety.
Copyright © 2021 Mncube, Möller and Harvey.
Conflict of interest statement
With respect to this work, the authors declare that over the past 3 years, BH has participated in advisory boards and received honoraria from Servier and Lundbeck, and has received research funding from Servier, Lundbeck, and HG & H Pharma. BH would like to declare that this paper is a contribution to a Research Topic entitled “Animal Models in Psychiatry: Translating Animal Behavior to an Improved Understanding and Treatment of Psychiatric Disorders”, where he is a Topic Editor. The authors declare that, except for income from the primary employer and research funding to BH from the below-mentioned organisations and agencies, no financial support or compensation has been received from any individual or corporate entity over the past 3 years for research or professional services, and there are no personal financial holdings that could be perceived as constituting a potential conflict of interest. The remaining authors declare that the research was conducted in the absence of any commercial or financial relationships that could be construed as a potential conflict of interest.
Figures
Similar articles
-
Bio-behavioural changes in treatment-resistant socially isolated FSL rats show variable or improved response to combined fluoxetine-olanzapine versus olanzapine treatment.IBRO Neurosci Rep. 2022 Sep 5;13:284-298. doi: 10.1016/j.ibneur.2022.08.009. eCollection 2022 Dec. IBRO Neurosci Rep. 2022. PMID: 36204253 Free PMC article.
-
Exploring a post-traumatic stress disorder paradigm in Flinders sensitive line rats to model treatment-resistant depression I: bio-behavioural validation and response to imipramine.Acta Neuropsychiatr. 2017 Aug;29(4):193-206. doi: 10.1017/neu.2016.44. Epub 2016 Aug 30. Acta Neuropsychiatr. 2017. PMID: 27573792
-
Long-term effects of pre-pubertal fluoxetine on behaviour and monoaminergic stress response in stress-sensitive rats.Acta Neuropsychiatr. 2017 Aug;29(4):222-235. doi: 10.1017/neu.2016.53. Epub 2016 Nov 7. Acta Neuropsychiatr. 2017. PMID: 27819195
-
Administration of antidepressants, diazepam and psychomotor stimulants further confirms the utility of Flinders Sensitive Line rats as an animal model of depression.Psychopharmacology (Berl). 1995 Sep;121(1):27-37. doi: 10.1007/BF02245589. Psychopharmacology (Berl). 1995. PMID: 8539339 Review.
-
The Flinders sensitive line rats: a genetic animal model of depression.Neurosci Biobehav Rev. 1993 Spring;17(1):51-68. doi: 10.1016/s0149-7634(05)80230-1. Neurosci Biobehav Rev. 1993. PMID: 8455816 Review.
Cited by
-
Chronic social comparison elicits depression- and anxiety-like behaviors and alterations in brain-derived neurotrophic factor expression in male rats.Anim Cogn. 2023 Sep;26(5):1505-1519. doi: 10.1007/s10071-023-01798-7. Epub 2023 Jun 11. Anim Cogn. 2023. PMID: 37302101
-
The effect of acute crocin on behavioral changes and BDNF expression level in socially isolated rats.Naunyn Schmiedebergs Arch Pharmacol. 2024 Jun;397(6):3929-3944. doi: 10.1007/s00210-023-02843-5. Epub 2023 Nov 21. Naunyn Schmiedebergs Arch Pharmacol. 2024. PMID: 37987792
-
Bio-behavioural changes in treatment-resistant socially isolated FSL rats show variable or improved response to combined fluoxetine-olanzapine versus olanzapine treatment.IBRO Neurosci Rep. 2022 Sep 5;13:284-298. doi: 10.1016/j.ibneur.2022.08.009. eCollection 2022 Dec. IBRO Neurosci Rep. 2022. PMID: 36204253 Free PMC article.
-
Nine-month-long Social Isolation Changes the Levels of Monoamines in the Brain Structures of Rats: A Comparative Study of Neurochemistry and Behavior.Neurochem Res. 2023 Jun;48(6):1755-1774. doi: 10.1007/s11064-023-03858-3. Epub 2023 Jan 21. Neurochem Res. 2023. PMID: 36680692
-
An Updated Bio-Behavioral Profile of the Flinders Sensitive Line Rat: Reviewing the Findings of the Past Decade.Pharmacol Res Perspect. 2025 Feb;13(1):e70058. doi: 10.1002/prp2.70058. Pharmacol Res Perspect. 2025. PMID: 39786312 Free PMC article. Review.
References
-
- Cusin C, Peyda S. Treatment-resistant depression. In: Shapero BG, Mischoulon D, Cusin C. editors. Book Treatment-Resistant Depression. Cham: Springer International Publishing; (2019). p. 3–19.
LinkOut - more resources
Full Text Sources
Miscellaneous