. 2021 Nov 19:12:710217.
doi: 10.3389/fimmu.2021.710217. eCollection 2021.

Data-Driven Analysis of COVID-19 Reveals Persistent Immune Abnormalities in Convalescent Severe Individuals

Affiliations

Data-Driven Analysis of COVID-19 Reveals Persistent Immune Abnormalities in Convalescent Severe Individuals

Jackwee Lim et al. Front Immunol. .

Abstract

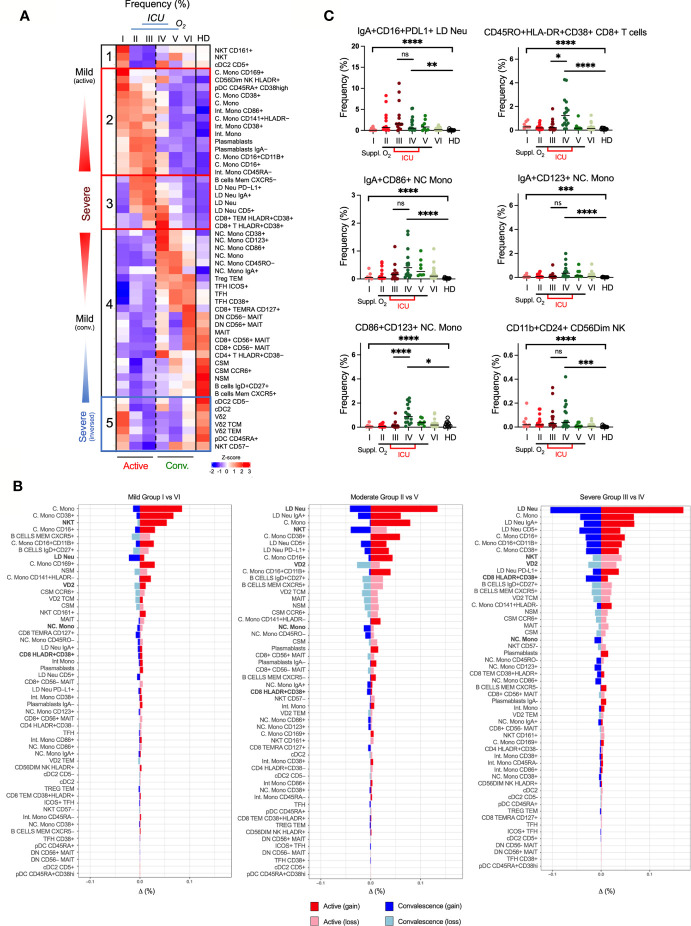
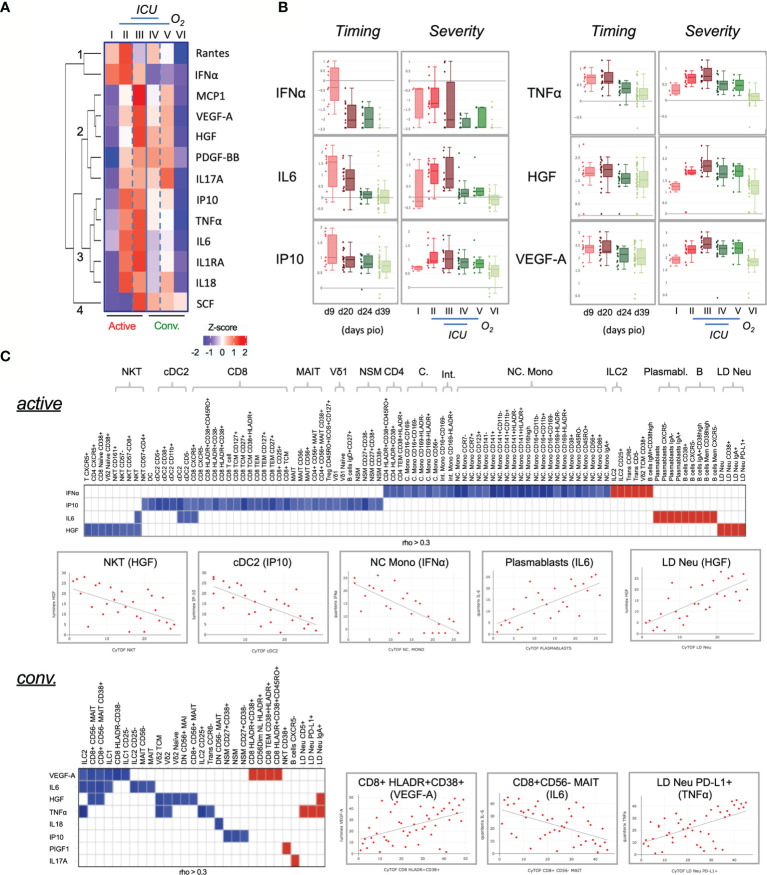
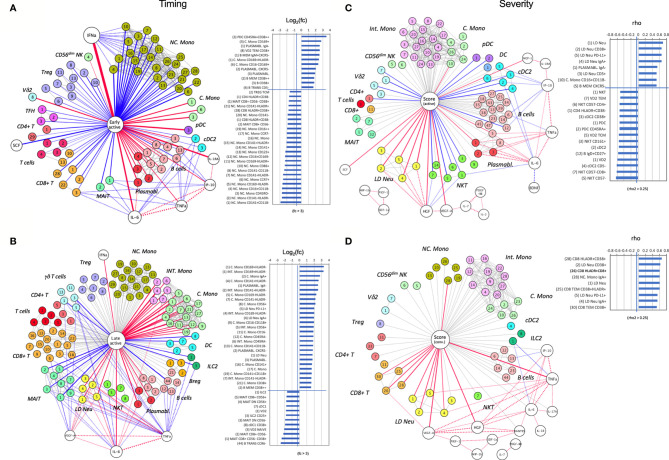
Severe SARS-CoV-2 infection can trigger uncontrolled innate and adaptive immune responses, which are commonly associated with lymphopenia and increased neutrophil counts. However, whether the immune abnormalities observed in mild to severely infected patients persist into convalescence remains unclear. Herein, comparisons were drawn between the immune responses of COVID-19 infected and convalescent adults. Strikingly, survivors of severe COVID-19 had decreased proportions of NKT and Vδ2 T cells, and increased proportions of low-density neutrophils, IgA+/CD86+/CD123+ non-classical monocytes and hyperactivated HLADR+CD38+ CD8+ T cells, and elevated levels of pro-inflammatory cytokines such as hepatocyte growth factor and vascular endothelial growth factor A, long after virus clearance. Our study suggests potential immune correlates of "long COVID-19", and defines key cells and cytokines that delineate true and quasi-convalescent states.

Keywords: COVID-19; SARS – CoV – 2; active infection; cytokine profile; immune recovery; immunophenotyping; inflammation; severity.


Conflict of interest statement

The authors declare that the research was conducted in the absence of any commercial or financial relationships that could be construed as a potential conflict of interest.

Figures

Figure 1
Figure 1
Study design and clinical characteristics of the cohort. (A) Schematic showing the pipeline for sample acquisition and analysis. A list of the antibody targets is presented. (B) Timelines for individual COVID-19 cases, indicating points of sample collection and any clinically pertinent detail e.g. duration of hospitalization, oxygen supplementation and admission to the intensive care unit (ICU). Patients are grouped as a function of days post illness onset (PIO) – d9 (early active; median: 9 days PIO), d20 (late active; median: 20 days PIO), d25 (early convalescence; median: 25 days PIO), d39 (late convalescence; median: 39 days PIO).
Figure 2
Figure 2
Frequency changes in 38 basic immune cell populations with SARS-CoV-2 infection. (A) Uniform Manifold Approximation and Projection (UMAP) plots of 38 main immune cell populations detected by mass cytometry (left). Right: Bubble representation of fold changes in the detected populations during activeinfection relative to convalescence, with color-coding done on a log2 scale, and bubble size reflecting the percentage of the subset. (B) Frequency-time plots of immune cell populations of interest over the course of disease. Asterisks indicate statistical significance- ns, not significant, *p < 0.03; **p < 0.002; ***p < 0.0002, ****p < 0.0001 (Kruskal-Wallis test with multiple comparison corrected on each disease phases versus healthy controls).
Figure 3
Figure 3
Temporal changes in frequencies and surface marker expression profiles of various immunotypes during active and convalescent COVID-19. (A) Left: Heatmap of CyTOF data of the frequencies of all 38 basic immune cell populations as a function of days post illness onset (PIO) – d9 (early active), d20 (late active), d25 (early convalescence) and d39 (late convalescence). Asterisks indicate statistical significance - *p < 0.05; **p < 0.01; ***p < 0.001 (Kruskal-Wallis test with multiple comparison corrected on all disease phases and healthy controls). Right: up- or down-regulation of indicated surface markers for the 38 main immune cell populations as a function of disease phase. (B) Left: Heatmap of CyTOF data of the frequencies of the top 38 immunotypes as a function of disease phase. Right: Box-and-whiskers plots of select immunotypes showing the frequency-time relationships, with mean and IQR indicated. “Late Con” refers to a group of immunotypes, which fail to recover to healthy levels even in late convalescence as post-infection aberrations. Asterisks indicate statistical significance- ns, not significant, *p < 0.03; **p < 0.002; ***p < 0.0002, ****p < 0.0001 (Kruskal-Wallis test with multiple comparison corrected on each disease phases versus healthy controls).
Figure 4
Figure 4
Alterations of immunotypes associated with the six-group disease severity states. (A) Distribution of 38 immune cells among group I active mild symptomatic, group II active suppl. O2 group III active suppl. O2 ICU, group IV convalescent suppl. O2 ICU, group V convalescent Suppl. O2 and group VI convalescent mild symptomatic using UMAP clustering. Color indicates the log2 fold change in the frequency against healthy donors. (B) TriMap clustering of CD16+/hi LD Neu, Vδ2 TCM, Vδ2 TEM, pan-CD57- NKT, pDC, cDC2, IgA+/- plasmablasts, IgD+CD27+ NSM, HLA-DR+CD38+ CD8 T cells, C. Mono, Int. Mono and NC. Mono among 6 groups of SAR-CoV-2 patients and healthy donors (HD). The absolute number shown for the immune cells has been normalized per 300,000 PBMCs and thus reflects its frequency.
Figure 5
Figure 5
Association of immunotypes with COVID-19 disease severity in active and convalescent individuals. (A) Left: Heatmap of CyTOF data of frequencies of 53 immune cell populations among the 6 group severity stratifications and divided into five clusters. Right: Box-and-whiskers plots showing means and IQR increased and reduced frequency of immune cell pollutions with disease severity. (B) Enumeration of immune cell frequencies compared across severity groups against healthy donors. Selected immunotypes mentioned in this study are shown in bold. (C) Profiles of immunotypes persisting in convalescent severe patients. Immunotypes of LD Neu, HLA-DR+CD38+ CD8+ T cells, CD86+/CD123+ NC. Mono and C56Dim NK cells, are further defined by co-expression of PD-L1, IgA, CD11b, CD16, CD24 or CD45RO frequencies. Scatter plots depict the means with SEM. ns, not significant, *p < 0.03; **p < 0.002; ***p < 0.0002, ****p < 0.0001 (Kruskal-Wallis test with multiple comparison corrected on each disease severity group versus total healthy). See Supplementary Figure 7 for comparisons with Vδ2 T and NKT cells.
Figure 6
Figure 6
Characterization of cytokines in COVID-19 patients. (A) Changes in cytokine levels among COVID-19 patients based on timing and severity. The heatmap shows the z-scores of the mean logarithmically transformed concentration of the 13 cytokines (of a total of 28) showing significant differences between any of the 6 severity groups. The z-scores are colored in red for positive values and in blue for negative values. The cytokines are clustered using hierarchical clustering using Euclidean distances into four clusters, which are labeled 1 to 4 in the figure. (B) Box plots of selected cytokines showing differences in timing and/or severity. The timing (left panels) refers to the plasma cytokine levels detected on the respective day post illness onset (PIO), the severity (right panels) to the levels detected in the 6 severity groups. Red colors refer to samples from the active phase, green to convalescence phase. An interactive viewer is available in the online content: data availability section. (C) Associations between cytokine level and cell frequency during active and convalescent phase. The heatmap displays the strength of the association indicated by the correlation coefficient (rho). Color indicated the direction (Red: positive, blue: negative). Only associations abs(rho) > 0.3 and p < 0.05 are shown. Selected examples of these correlations are shown in the scatter plots. An interactive viewer is available in the Materials and Methods: Data and Code Availability section.
Figure 7
Figure 7
A node-edge interaction network of the cytokine level and immune cellular frequencies in COVID-19 patients. Association are shown with regard to the timing (A, B) and the severity (C, D). Nodes represent either cytokines (white) or immunotypes (colored). The central node represents the “comparison of interest”. The edges represent significant associations between two nodes with the thickness indicating the strength either based on fold change or correlation coefficient (rho). Color indicates the direction (Red: positive, blue: negative), dotted lines indicate associations with cytokines. For the central node, only associations with abs(rho) > 0.3 and p < 0.05 are colored and shown as bar charts on the right. For the timing (A, B) these bar charts indicate the fold changes in the early active; median day 9 PIO (A), and late active state; median day 24 PIO (B) in reference to late convalescent state while for the severity (C, D) they represent the correlation coefficient (rho) in reference to the severity groups in the active (C) and convalescent state (D). The number code of the immunotype is listed in Supplementary Table 3 , an interactive network viewer is available in the Materials and Methods: Data and Code Availability section. ++ denotes highly stained immunotype.

References

    1. Huang C, Wang Y, Li X, Ren L, Zhao J, Hu Y, et al. Clinical Features of Patients Infected With 2019 Novel Coronavirus in Wuhan, China. Lancet (2020) 395:497–506. doi: 10.1016/S0140-6736(20)30183-5 - DOI - PMC - PubMed
    1. Song JW, Zhang C, Fan X, Meng FP, Xu Z, Xia P, et al. Immunological and Inflammatory Profiles in Mild and Severe Cases of COVID-19. Nat Commun (2020) 11(1):3410. doi: 10.1038/s41467-020-17240-2 - DOI - PMC - PubMed
    1. Manson JJ, Crooks C, Naja M, Ledlie A, Goulden B, Liddle T, et al. COVID-19-Associated Hyperinflammation and Escalation of Patient Care: A Retrospective Longitudinal Cohort Study. Lancet Rheumatol (2020) 2(10):e594–602. doi: 10.1016/S2665-9913(20)30275-7 - DOI - PMC - PubMed
    1. Surveillances V. The Epidemiological Characteristics of an Outbreak of 2019 Novel Coronavirus Diseases (COVID-19) in China. China CDC Wkly (2020) 2:113–22. doi: 10.46234/ccdcw2020.032 - DOI - PMC - PubMed
    1. Jouan Y, Guillon A, Gonzalez L, Perez Y, Ehrmann S, Ferreira M, et al. Functional Alteration of Innate T Cells in Critically Ill Covid-19 Patients. medRxiv (2020) 2020. doi: 10.1101/2020.05.03.20089300. 05.03.20089300. - DOI

Publication types