

Analysis of Serological Biomarkers of SARS-CoV-2 Infection in Convalescent Samples From Severe, Moderate and Mild COVID-19 Cases
- PMID: 34867975
- PMCID: PMC8640495
- DOI: 10.3389/fimmu.2021.748291
Analysis of Serological Biomarkers of SARS-CoV-2 Infection in Convalescent Samples From Severe, Moderate and Mild COVID-19 Cases
Abstract
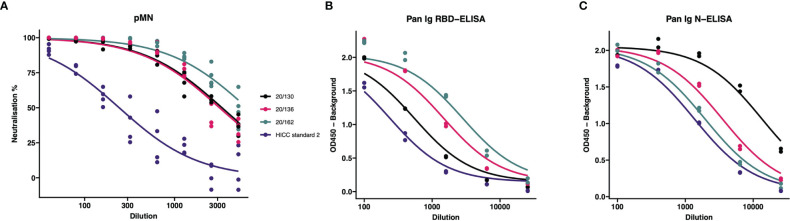
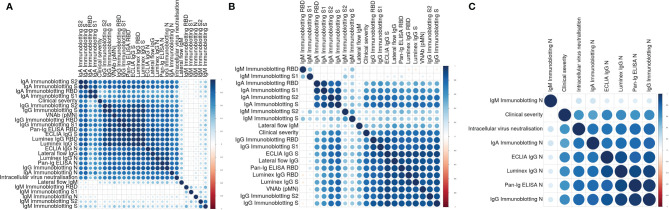
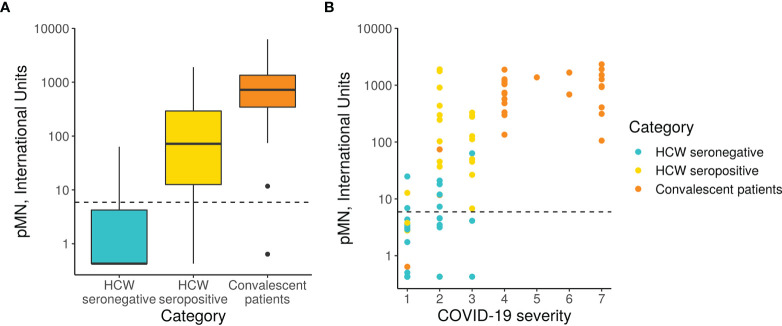
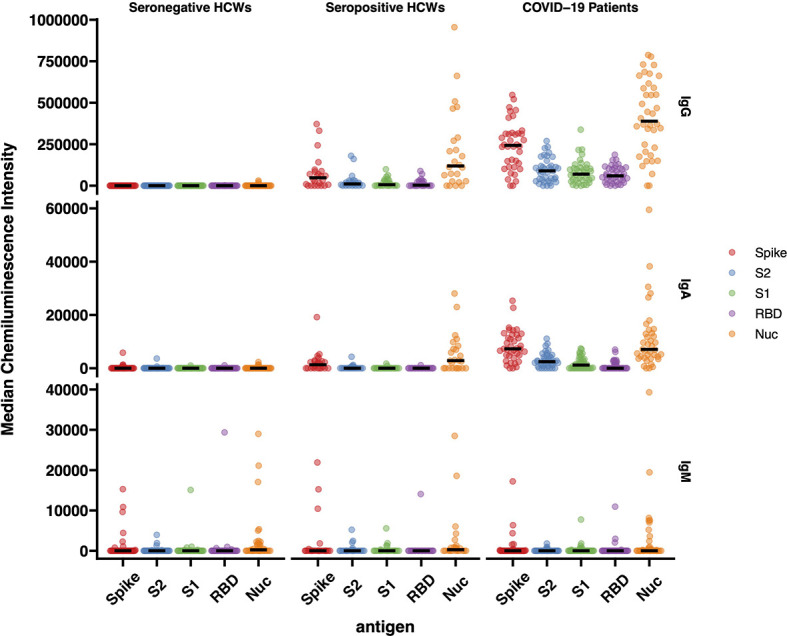
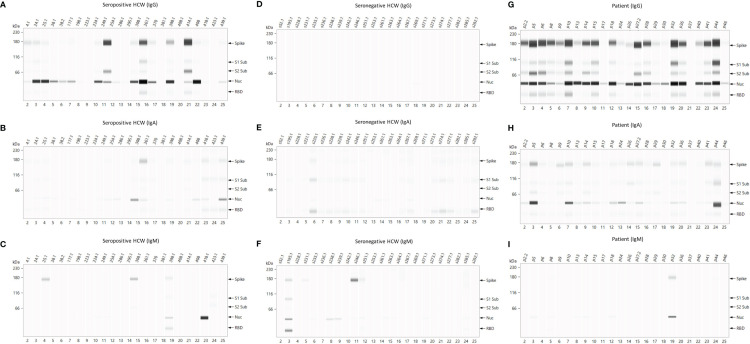
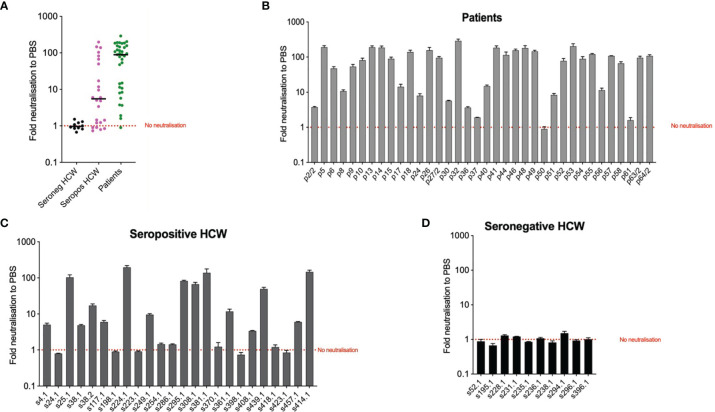
Precision monitoring of antibody responses during the COVID-19 pandemic is increasingly important during large scale vaccine rollout and rise in prevalence of Severe Acute Respiratory Syndrome-related Coronavirus-2 (SARS-CoV-2) variants of concern (VOC). Equally important is defining Correlates of Protection (CoP) for SARS-CoV-2 infection and COVID-19 disease. Data from epidemiological studies and vaccine trials identified virus neutralising antibodies (Nab) and SARS-CoV-2 antigen-specific (notably RBD and S) binding antibodies as candidate CoP. In this study, we used the World Health Organisation (WHO) international standard to benchmark neutralising antibody responses and a large panel of binding antibody assays to compare convalescent sera obtained from: a) COVID-19 patients; b) SARS-CoV-2 seropositive healthcare workers (HCW) and c) seronegative HCW. The ultimate aim of this study is to identify biomarkers of humoral immunity that could be used to differentiate severe from mild or asymptomatic SARS-CoV-2 infections. Some of these biomarkers could be used to define CoP in further serological studies using samples from vaccination breakthrough and/or re-infection cases. Whenever suitable, the antibody levels of the samples studied were expressed in International Units (IU) for virus neutralisation assays or in Binding Antibody Units (BAU) for ELISA tests. In this work we used commercial and non-commercial antibody binding assays; a lateral flow test for detection of SARS-CoV-2-specific IgG/IgM; a high throughput multiplexed particle flow cytometry assay for SARS-CoV-2 Spike (S), Nucleocapsid (N) and Receptor Binding Domain (RBD) proteins); a multiplex antigen semi-automated immuno-blotting assay measuring IgM, IgA and IgG; a pseudotyped microneutralisation test (pMN) and an electroporation-dependent neutralisation assay (EDNA). Our results indicate that overall, severe COVID-19 patients showed statistically significantly higher levels of SARS-CoV-2-specific neutralising antibodies (average 1029 IU/ml) than those observed in seropositive HCW with mild or asymptomatic infections (379 IU/ml) and that clinical severity scoring, based on WHO guidelines was tightly correlated with neutralisation and RBD/S antibodies. In addition, there was a positive correlation between severity, N-antibody assays and intracellular virus neutralisation.
Keywords: Antibodies; COVID-19; COVID-19 immune response; Correlates of Protection; SARS-CoV-2; Serological biomarkers; WHO International Standard.
Copyright © 2021 Castillo-Olivares, Wells, Ferrari, Chan, Smith, Nadesalingam, Paloniemi, Carnell, Ohlendorf, Cantoni, Mayora-Neto, Palmer, Tonks, Temperton, Peterhoff, Neckermann, Wagner, Doffinger, Kempster, Otter, Semper, Brooks, Albecka, James, Page, Schwaeble, Baxendale and Heeney.
Conflict of interest statement
DAW, MF, RW and JH are affiliated to the company DIOSynVax. JC-O holds a position as vaccinology consultant at Oxford Expression Technologies, Ltd. The remaining authors declare that the research was conducted in the absence of any commercial or financial relationships that could be construed as a potential conflict of interest.
Figures
Similar articles
-
Anti-SARS-CoV-2 serology based on ancestral RBD antigens does not correlate with the presence of neutralizing antibodies against Omicron variants.Microbiol Spectr. 2025 Jan 7;13(1):e0156824. doi: 10.1128/spectrum.01568-24. Epub 2024 Nov 20. Microbiol Spectr. 2025. PMID: 39565133 Free PMC article.
-
Long-Term Humoral Immune Response against SARS-CoV-2 after Natural Infection and Subsequent Vaccination According to WHO International Binding Antibody Units (BAU/mL).Viruses. 2021 Nov 23;13(12):2336. doi: 10.3390/v13122336. Viruses. 2021. PMID: 34960605 Free PMC article.
-
Analytical measuring interval, linearity, and precision of serology assays for detection of SARS-CoV-2 antibodies according to CLSI guidelines.mSphere. 2024 Nov 21;9(11):e0039324. doi: 10.1128/msphere.00393-24. Epub 2024 Oct 31. mSphere. 2024. PMID: 39480103 Free PMC article.
-
Antibody tests for identification of current and past infection with SARS-CoV-2.Cochrane Database Syst Rev. 2020 Jun 25;6(6):CD013652. doi: 10.1002/14651858.CD013652. Cochrane Database Syst Rev. 2020. Update in: Cochrane Database Syst Rev. 2022 Nov 17;11:CD013652. doi: 10.1002/14651858.CD013652.pub2. PMID: 32584464 Free PMC article. Updated.
-
Antibody response to SARS-CoV-2 infection in humans: A systematic review.PLoS One. 2020 Dec 31;15(12):e0244126. doi: 10.1371/journal.pone.0244126. eCollection 2020. PLoS One. 2020. PMID: 33382764 Free PMC article.
Cited by
-
A new multiplex SARS-CoV-2 antigen microarray showed correlation of IgG, IgA, and IgM antibodies from patients with COVID-19 disease severity and maintenance of relative IgA and IgM antigen binding over time.PLoS One. 2023 Mar 30;18(3):e0283537. doi: 10.1371/journal.pone.0283537. eCollection 2023. PLoS One. 2023. PMID: 36996259 Free PMC article.
-
Pseudotyped Bat Coronavirus RaTG13 is efficiently neutralised by convalescent sera from SARS-CoV-2 infected patients.Commun Biol. 2022 May 3;5(1):409. doi: 10.1038/s42003-022-03325-9. Commun Biol. 2022. PMID: 35505237 Free PMC article.
-
Human seasonal coronavirus neutralization and COVID-19 severity.J Med Virol. 2022 Oct;94(10):4820-4829. doi: 10.1002/jmv.27937. Epub 2022 Jul 18. J Med Virol. 2022. PMID: 35705514 Free PMC article.
-
Differential T-cell and antibody responses induced by mRNA versus adenoviral vectored COVID-19 vaccines in patients with immunodeficiencies.J Allergy Clin Immunol Glob. 2023 May;2(2):100091. doi: 10.1016/j.jacig.2023.100091. Epub 2023 Mar 15. J Allergy Clin Immunol Glob. 2023. PMID: 37038555 Free PMC article.
-
SARS-CoV-2 antibody progression and neutralizing potential in mild symptomatic COVID-19 patients - a comparative long term post-infection study.Front Immunol. 2022 Aug 17;13:915338. doi: 10.3389/fimmu.2022.915338. eCollection 2022. Front Immunol. 2022. PMID: 36059441 Free PMC article.
References
-
- COVID-19 Public Health Emergency of International Concern (PHEIC) Global Research and Innovation Forum. Available at: https://www.who.int/publications/m/item/covid-19-public-health-emergency... (Accessed April 29, 2021).
-
- Weekly Epidemiological Update on COVID-19 - 20 April 2021 (2021). Available at: https://www.who.int/publications/m/item/weekly-epidemiological-update-on... (Accessed April 29, 2021).
-
- Draft Landscape and Tracker of COVID-19 Candidate Vaccines. Available at: https://www.who.int/publications/m/item/draft-landscape-of-covid-19-cand... (Accessed April 29, 2021).
Publication types
MeSH terms
Substances
Grants and funding
LinkOut - more resources
Full Text Sources
Medical
Miscellaneous