. 2021 Nov 15:12:763888.
doi: 10.3389/fimmu.2021.763888. eCollection 2021.

Radiation Augments the Local Anti-Tumor Effect of In Situ Vaccine With CpG-Oligodeoxynucleotides and Anti-OX40 in Immunologically Cold Tumor Models

Affiliations

Radiation Augments the Local Anti-Tumor Effect of In Situ Vaccine With CpG-Oligodeoxynucleotides and Anti-OX40 in Immunologically Cold Tumor Models

Alexander A Pieper et al. Front Immunol. .

Abstract

Introduction: Combining CpG oligodeoxynucleotides with anti-OX40 agonist antibody (CpG+OX40) is able to generate an effective in situ vaccine in some tumor models, including the A20 lymphoma model. Immunologically "cold" tumors, which are typically less responsive to immunotherapy, are characterized by few tumor infiltrating lymphocytes (TILs), low mutation burden, and limited neoantigen expression. Radiation therapy (RT) can change the tumor microenvironment (TME) of an immunologically "cold" tumor. This study investigated the effect of combining RT with the in situ vaccine CpG+OX40 in immunologically "cold" tumor models.

Methods: Mice bearing flank tumors (A20 lymphoma, B78 melanoma or 4T1 breast cancer) were treated with combinations of local RT, CpG, and/or OX40, and response to treatment was monitored. Flow cytometry and quantitative polymerase chain reaction (qPCR) experiments were conducted to study differences in the TME, secondary lymphoid organs, and immune activation after treatment.

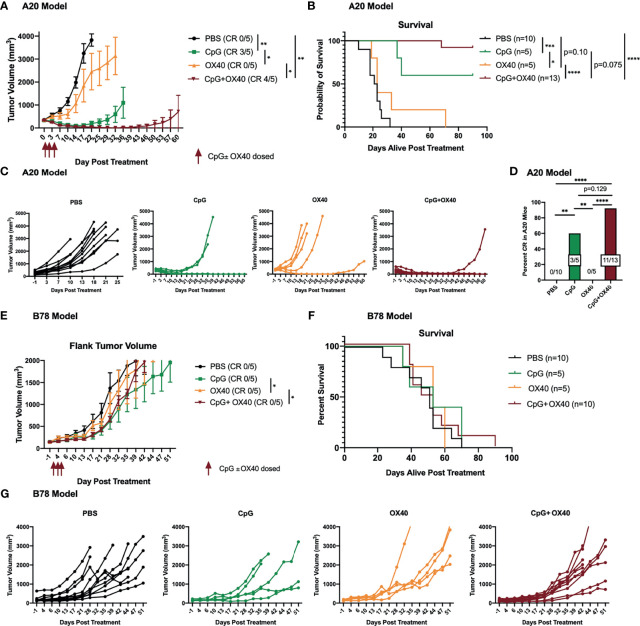
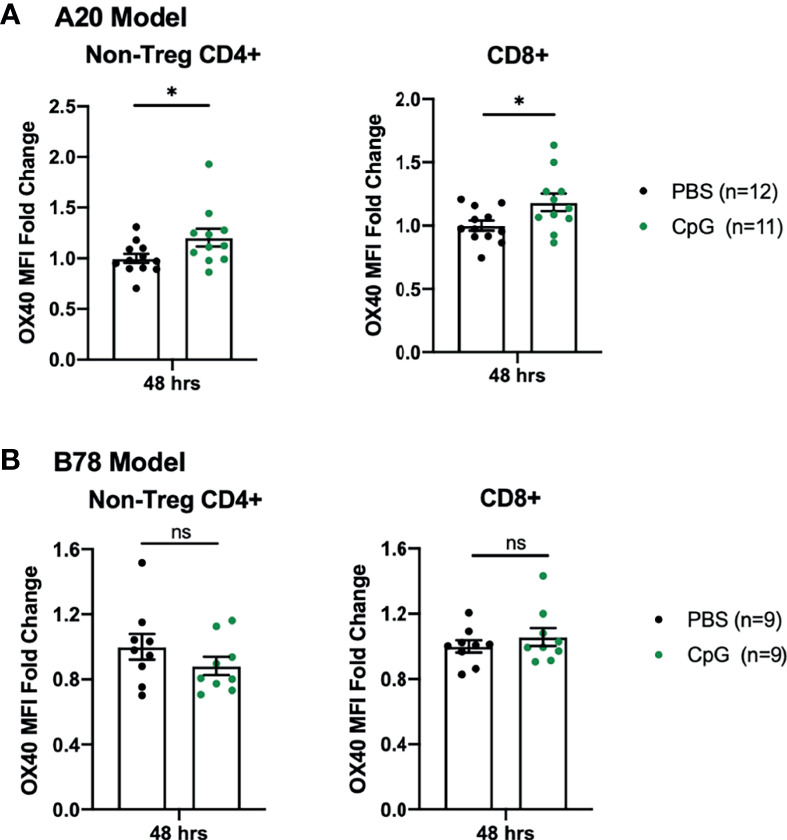
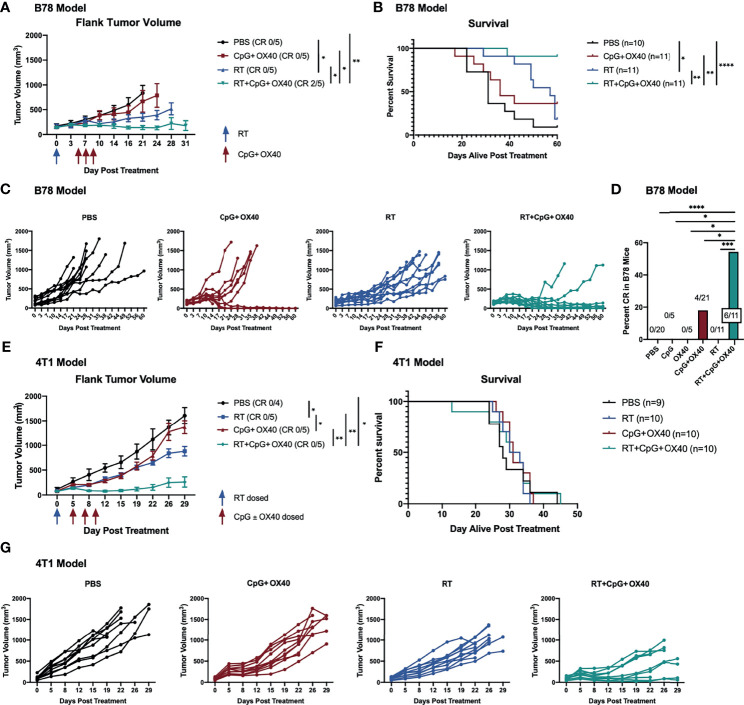
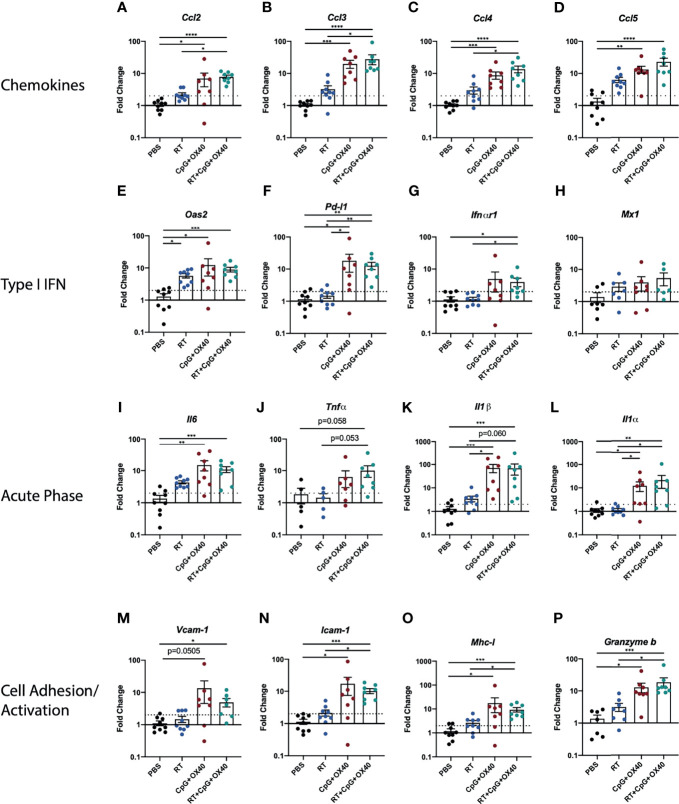
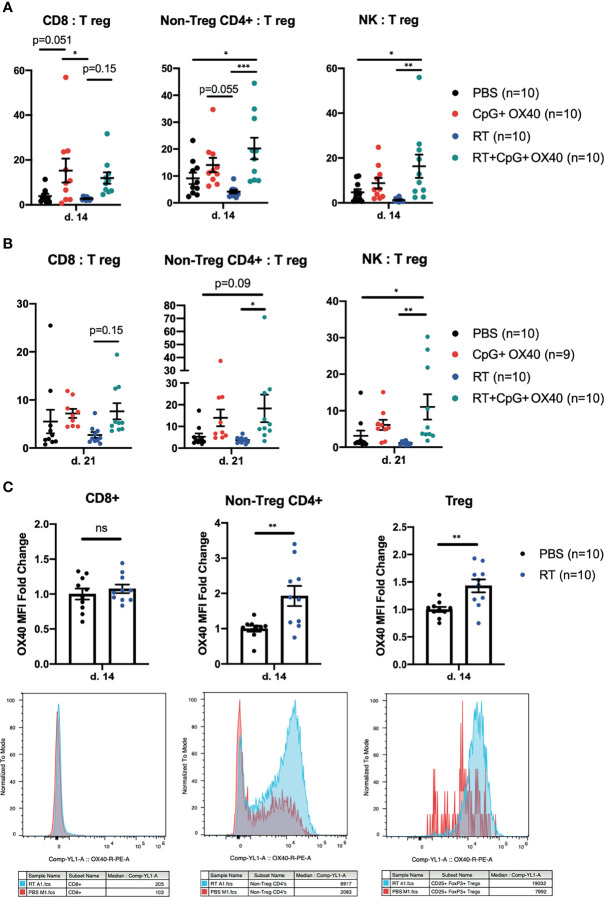
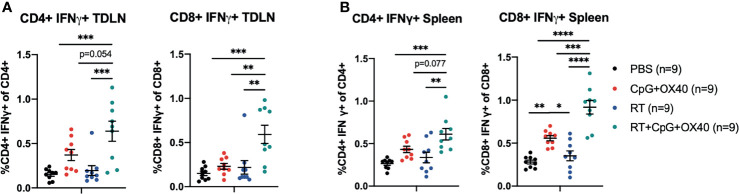
Results: An in situ vaccine regimen of CpG+OX40, which was effective in the A20 model, did not significantly improve tumor response or survival in the "cold" B78 and 4T1 models, as tested here. In both models, treatment with RT prior to CpG+OX40 enabled a local response to this in situ vaccine, significantly improving the anti-tumor response and survival compared to RT alone or CpG+OX40 alone. RT increased OX40 expression on tumor infiltrating CD4+ non-regulatory T cells. RT+CpG+OX40 increased the ratio of tumor-infiltrating effector T cells to T regulatory cells and significantly increased CD4+ and CD8+ T cell activation in the tumor draining lymph node (TDLN) and spleen.

Conclusion: RT significantly improves the local anti-tumor effect of the in situ vaccine CpG+OX40 in immunologically "cold", solid, murine tumor models where RT or CpG+OX40 alone fail to stimulate tumor regression.

Keywords: CpG – oligonucleotides; In situ vaccine; OX40 agonist; cold tumor models; radiation therapy; radioimmunotherapy.


Conflict of interest statement

ZM is a member of the scientific advisory board for Archeus Technologies and Seneca Therapeutics and received equity options for these companies. ZM is an inventor on patents or filed patents managed by the Wisconsin Alumni Research Foundation relating to the interaction of targeted radionuclide therapies and immunotherapies, nanoparticles designed to augment the anti-tumor immune response following radiation therapy, and the development of a brachytherapy catheter capable of delivering intra-tumor injectables. PS is an inventor on patents or filed patents managed by the Wisconsin Alumni Research Foundation relating to mAb-related immunotherapies and the interaction of targeted radionuclide therapies and immunotherapies. The remaining authors declare that the research was conducted in the absence of any commercial or financial relationships that could be construed as a potential conflict of interest. The reviewer WS declared a shared affiliation with one of the authors, RP, to the handling editor at the time of the review.

Figures

Figure 1
Figure 1
CpG+OX40 In Situ Vaccine Cures Mice of A20 Lymphoma but Fails to Cause Tumor Regression in B78 Melanoma. (A) Average tumor volume plots (+/- standard error of the mean) from one representative experiment, and (B) combined overall survival in the A20 model showing group responses to PBS (black), CpG (green), OX40 (yellow), and CpG+OX40 (red). The number of mice that were cured of their tumor burden in (A) are shown in parentheses (CR). The anti-tumor response of CpG alone and OX40 alone were tested in one experiment (in A), while the strong anti-tumor response of CpG+OX40 in the A20 model was tested in two independent experiments [shown together in (B)]. (C) Combined individual animal tumor growth plots for each animal shown in (A, B). (D) The percent of A20 tumor bearing mice in B that were cured of their tumor burden following treatment with PBS, CpG, OX40, and CpG+OX40. (E) Tumor volume plots (+/- standard error of the mean) from one representative experiment, and (F) overall survival in the B78 model showing group responses to PBS (black), CpG (green), OX40 (yellow), and CpG+OX40 (red). The number of mice that were cured of their tumor burden in E are shown in parentheses. The anti-tumor response of CpG alone and OX40 alone were tested in one experiment in (E), while the lack of anti-tumor response of CpG+OX40 in the B78 model was tested in two independent experiments [shown together in (F)]. (G) Individual tumor growth curves of mice in E showing responses to PBS (black), CpG (green), OX40 (yellow), and CpG+OX40 (red) in the B78 model. Red arrows shown in (A, E) indicate the days CpG and/or OX40 were dosed IT (d. 0, 2, 4). In both tumor models, n=5-8 per group per experiment. P values for average tumor volume plots calculated using time-weighted average analysis. P values for overall survival calculated via log rank test. P values for CR rates calculated via one-way ANOVA. *P ≤ 0.05; **P ≤ 0.01; ***P ≤ 0.001; ****P ≤ 0.0001.
Figure 2
Figure 2
B78 and A20 Tumor Models Demonstrate Differences in Response to CpG Treatment. (A) OX40 MFI fold change expression on non-Treg CD4+ or CD8+ tumor infiltrating T cells in the A20 model 48 hours after treatment with PBS (black) or CpG (green). (B) OX40 MFI fold change expression on non-Treg CD4+ or CD8+ tumor infiltrating T cells in the B78 model 48 hours after treatment with PBS (black) or CpG (green). The data plotted here are the results from two independent experiments (n=4-6 per group, per experiment). Average OX40 MFI values in the PBS cohort were calculated for each separate experiment, then used to determine fold-change differences for each sample from that particular experiment. Each symbol represents the MFI fold change from one mouse. Flow gating strategy is presented in Supplementary Figure 3. P values were calculated using Mann-Whitney tests. *P ≤ 0.05; NS, nonsignificant.
Figure 3
Figure 3
RT Enhances the Local Anti-Tumor Effect of CpG+OX40 in Multiple Tumor Models. (A) Average tumor volume plots (+/- standard error of the mean) from a representative experiment, and (B) combined overall survival from two independent experiments in the B78 model showing group responses to PBS (black), CpG+OX40 (red), RT (blue), and RT+CpG+OX40 (teal) along with the number of mice that demonstrated a complete response (CR) to treatment. (C) Combined individual tumor volume plots from two independent experiments showing each mouse’s response to various treatments shown in (B). (D) Number of B78 tumor-bearing mice showing a complete response for the summary of 4 experiments (shown in Figure 1F and Figure 2B) (E) Average tumor volume plots (+/- standard error of the mean) from a representative experiment, and (F) combined overall survival from two independent experiments in the 4T1 model showing group responses to PBS (black), CpG+OX40 (red), RT (blue), and RT+CpG+OX40 (teal) along with the number of mice that demonstrated a complete response to treatment. (G) Combined individual tumor volume plots from two independent experiments showing each mouse’s response to various treatments for the mice shown in (E) Red arrows shown in (A, E) indicate the days CpG and/or OX40 were dosed IT (d. 5, 7, 9), while blue arrows shown in (A, E) indicate if/when RT was dosed (d. 0). In both models, n=4-6 per group per experiment. P values for average tumor volume plots calculated using time-weighted average analysis. P values for overall survival calculated via log rank test. *P ≤ 0.05; **P ≤ 0.01; ***P ≤ 0.001; ****P ≤ 0.0001.
Figure 4
Figure 4
RT+CpG+OX40 Modifies Gene Expression in TME for Favorable Anti-Tumor Response. Fold-change gene expression of (A–D) chemokines, (E–H) type I IFN pathway genes, (I–L) acute phase inflammatory cytokines, and (M–P) cell adhesion and immune activation genes in the B78 model on day 14 following treatment initiation with PBS (black), RT (blue), CpG+OX40 (red), and RT+CpG+OX40 (teal). Results are presented from a single set of qPCR analyses that were run simultaneously on tumor tissue samples collected from two independent experiments (n=7-10 total per group). For each gene of interest, significance was determined by Kruskal-Wallis testing; if significance was found groups were compared via a Dunn test and adjusted using the Holm method. *P ≤ 0.05; **P ≤ 0.01; ***P ≤ 0.001; ****P ≤ 0.0001.
Figure 5
Figure 5
Phenotypic Changes in TIL Following In Situ Vaccination. (A, B) The combined results from two independent experiments (n=4-5 per group, per experiment) showing the ratios of CD8:Treg, CD4+ non-Treg : Treg, and NK : Treg within the B78 TME (A) 14 days and (B) 21 days after treatment with PBS (black), CpG+OX40 (red), RT (blue), and RT+CpG+OX40 (teal). (C) The combined results from two independent experiments (n=5 per group, per experiment) showing the fold-change in OX40 MFI expression on CD8+, CD4+ non-Treg cells, and Tregs within B78 tumors 14 days after treatment with PBS (black) or RT (blue). Representative histograms for each T cell subpopulation provided below fold-change figures. Average OX40 MFI values in the PBS cohort were calculated for each separate experiment, then used to determine fold change differences for each sample from that particular experiment. Each symbol represents the TIL from one mouse. Flow gating strategy is presented in Supplementary Figure 4. P values for effector/Treg ratios were calculated using one-way ANOVA with Tukey’s multiple comparison tests. P values for OX40 expression were calculated using a Mann-Whitney test. *P ≤ 0.05; **P ≤ 0.01; ***P ≤ 0.001; NS, nonsignificant.
Figure 6
Figure 6
RT+CpG+OX40 Increases CD4+ and CD8+ T Cell Activation in the TDLN and Spleen. The combined results from two independent experiments (n=4-5 per group, per experiment) showing the percent of CD4+ and CD8+ T cells that were positive for IFNγ, without ex vivo stimulation, in the TDLNs (A) and spleens (B) of mice treated with PBS (black), CpG+OX40 (red), RT (blue), and RT+CpG+OX40 (teal). Each symbol represents the immune cell double positive percent from one mouse. Flow gating strategy for these analyses is presented in Supplementary Figure 5. P values were calculated using one-way ANOVA with Tukey’s multiple comparison tests. *P ≤ 0.05; **P ≤ 0.01; ***P ≤ 0.001; ****P ≤ 0.0001.

References

    1. Couzin-Frankel J. Breakthrough of the Year 2013. Cancer Immunotherapy. Science (2013) 342(6165):1432–3. doi: 10.1126/science.342.6165.1432 - DOI - PubMed
    1. Patel SA, Minn AJ. Combination Cancer Therapy With Immune Checkpoint Blockade: Mechanisms and Strategies. Immunity (2018) 48(3):417–33. doi: 10.1016/j.immuni.2018.03.007 - DOI - PMC - PubMed
    1. Gentles AJ, Newman AM, Liu CL, S. Bratman V, Feng W, Kim D, et al. The Prognostic Landscape of Genes and Infiltrating Immune Cells Across Human Cancers. Nat Med (2015) 21(8):938–45. doi: 10.1038/nm.3909 - DOI - PMC - PubMed
    1. Sharma P, Allison JP. The Future of Immune Checkpoint Therapy. Science (2015) 348(6230):56–61. doi: 10.1126/science.aaa8172 - DOI - PubMed
    1. Gajewski TF. The Next Hurdle in Cancer Immunotherapy: Overcoming the Non-T-Cell-Inflamed Tumor Microenvironment. Semin Oncol (2015) 42(4):663–71. doi: 10.1053/j.seminoncol.2015.05.011 - DOI - PMC - PubMed

Publication types