. 2021 Nov 12:12:769088.
doi: 10.3389/fimmu.2021.769088. eCollection 2021.

Epigallocatechin-3-Gallate as a Novel Vaccine Adjuvant

Affiliations

Epigallocatechin-3-Gallate as a Novel Vaccine Adjuvant

Yucheol Cheong et al. Front Immunol. .

Abstract

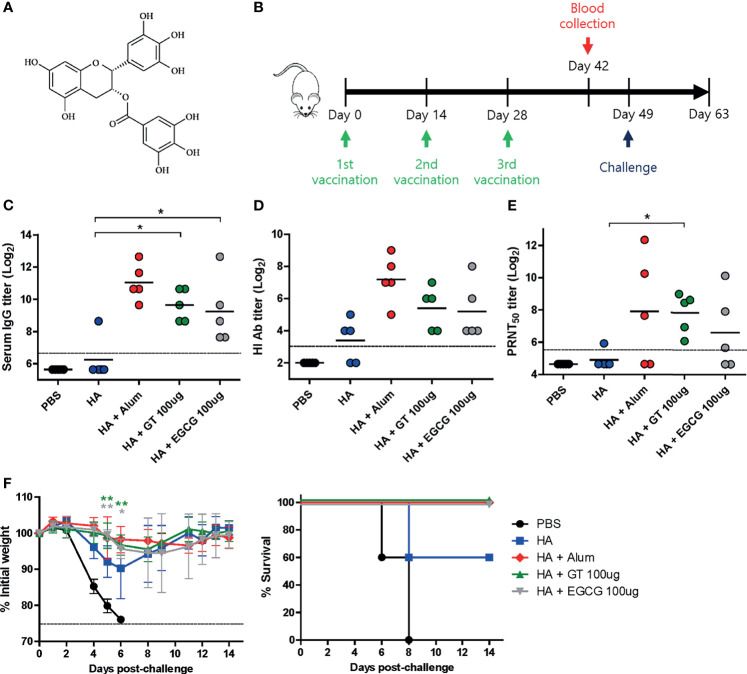
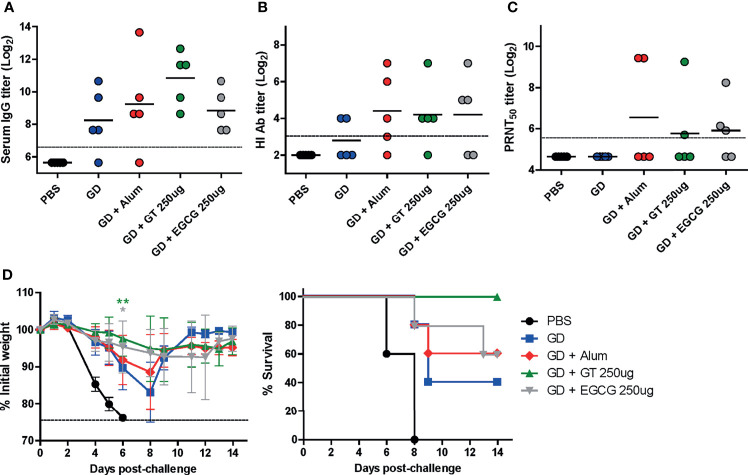
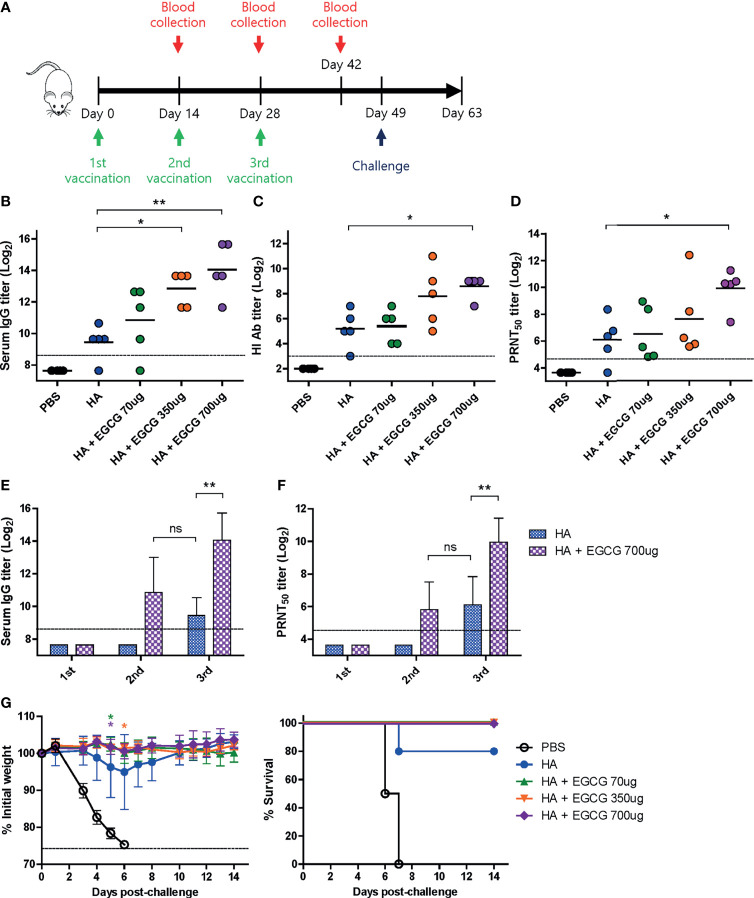
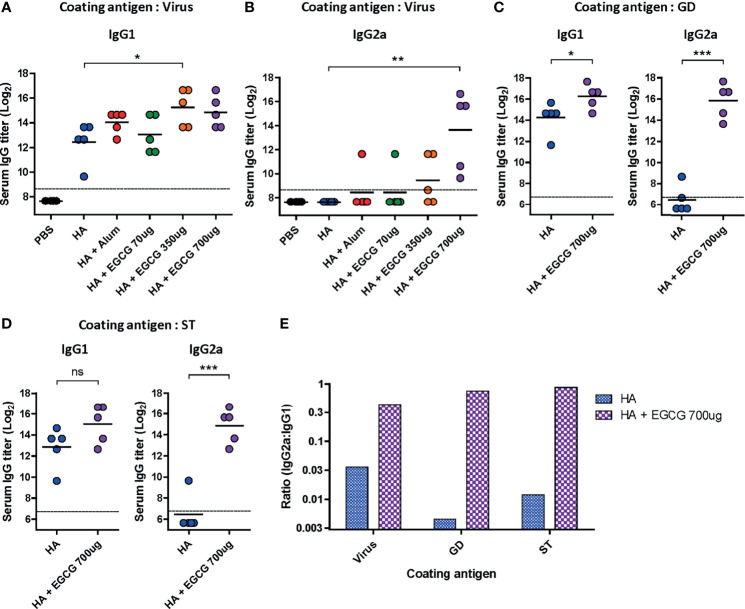
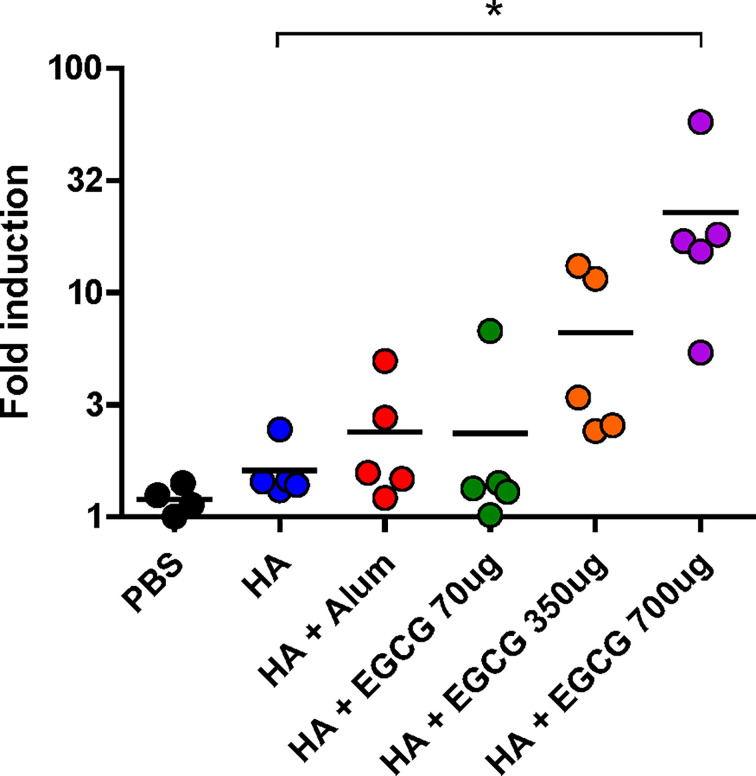
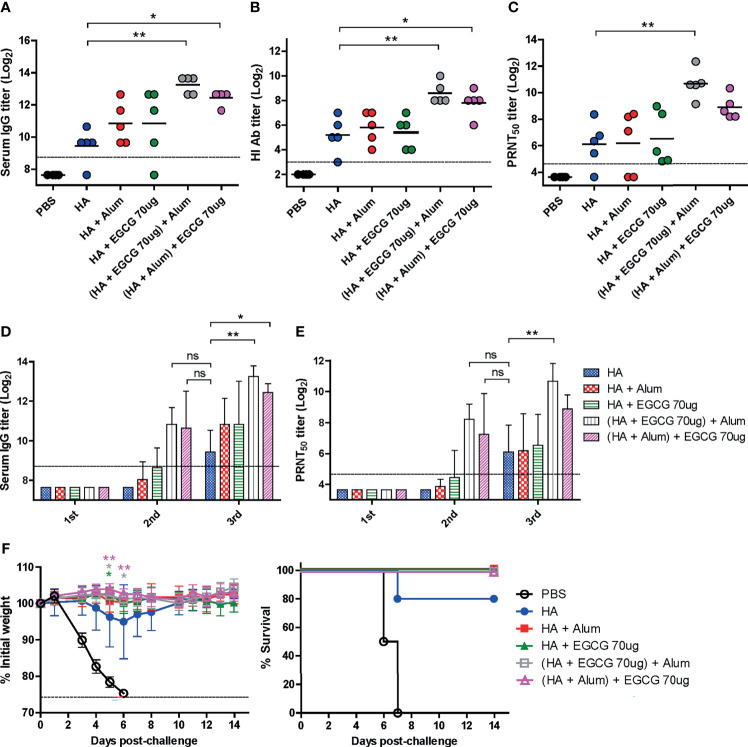
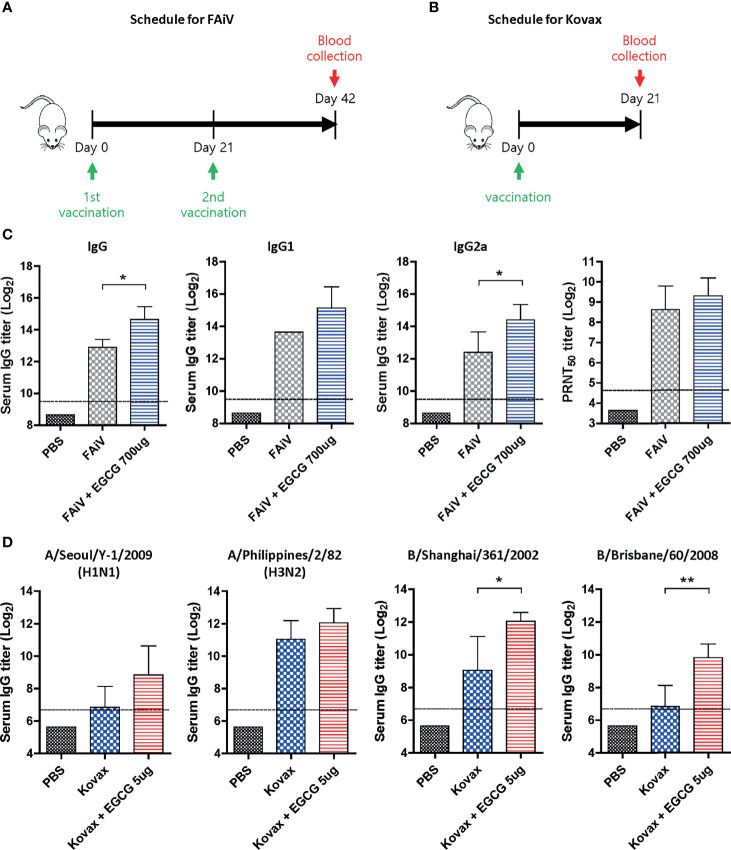
Vaccine adjuvants from natural resources have been utilized for enhancing vaccine efficacy against infectious diseases. This study examined the potential use of catechins, polyphenolic materials derived from green tea, as adjuvants for subunit and inactivated vaccines. Previously, catechins have been documented to have irreversible virucidal function, with the possible applicability in the inactivated viral vaccine platform. In a mouse model, the coadministration of epigallocatechin-3-gallate (EGCG) with influenza hemagglutinin (HA) antigens induced high levels of neutralizing antibodies, comparable to that induced by alum, providing complete protection against the lethal challenge. Adjuvant effects were observed for all types of HA antigens, including recombinant full-length HA and HA1 globular domain, and egg-derived inactivated split influenza vaccines. The combination of alum and EGCG further increased neutralizing (NT) antibody titers with the corresponding hemagglutination inhibition (HI) titers, demonstrating a dose-sparing effect. Remarkably, EGCG induced immunoglobulin isotype switching from IgG1 to IgG2a (approximately >64-700 fold increase), exerting a more balanced TH1/TH2 response compared to alum. The upregulation of IgG2a correlated with significant enhancement of antibody-dependent cellular cytotoxicity (ADCC) function (approximately 14 fold increase), providing a potent effector-mediated protection in addition to NT and HI. As the first report on a novel class of vaccine adjuvants with built-in virucidal activities, the results of this study will help improve the efficacy and safety of vaccines for pandemic preparedness.

Keywords: ADCC; EGCG; IgG isotype switching; adjuvant; influenza.


Conflict of interest statement

The authors declare that the research was conducted in the absence of any commercial or financial relationships that could be construed as a potential conflict of interest.

Figures

Figure 1
Figure 1
Adjuvant effects of GT or EGCG in combination with HA antigen. PBS or 4 μg of HA antigens (recombinant, full-length) with or without adjuvant (alum 50 μL, GT 100 μg, or EGCG 100 μg) were injected into mice via IM route thrice every 2 weeks. The vaccinated mice were challenged with 2 × 10³ PFU (2 MLD50) of wild type PR8 virus 3 weeks after the last vaccination. (A) Chemical structure of EGCG. (B) Vaccination, blood collection, and challenge schedule. (C) IgG antibody response to influenza PR8 virus. The antibody titer of each sample was expressed as the endpoint dilution with an absorbance value 2× greater than that of the PBS control group. The detection limit (dashed line) was 100. (D, E) Neutralizing antibody responses to influenza PR8 virus. HI antibody titers (D) and PRNT50 titers (E) against the PR8 virus are shown. The detection limits of HI assay and PRNT (dashed lines) were 8 and 50, respectively. (F) Protective efficacy against influenza PR8 virus. The changes in weight and survival rates of the mice were monitored. Dashed line indicates humane endpoint which means losing 25% weight loss. Mice that lost >25% body weight were euthanized. Data of antibody titers (C–E) were log-transformed and expressed as means (horizontal lines) and scatter plots. Data of the changes in weight (F, left panel) are shown as means (points) and standard deviations (error bars). One-way ANOVA followed by Tukey’s multiple comparison test was conducted to compare three or more groups. Repeated measures two-way ANOVA followed by Bonferroni’s post-test was used to analyze weight changes for different mouse groups over time. Each group was compared with the group given the non-adjuvanted HA (**P < 0.01; *P < 0.05).
Figure 2
Figure 2
Adjuvant effect of GT or EGCG on recombinant HA GD antigen. PBS or 10 µg of GD antigens with or without alum, GT, or EGCG were injected into mice via IM route thrice with the interval of two weeks. The overall experimental schedule was the same as presented in Figure 1B . (A) IgG antibody response to influenza PR8 virus. The antibody titer of each sample was expressed as the endpoint dilution with an absorbance value 2× greater than that of the PBS control group. The detection limit (dashed line) was 100. (B, C) Neutralizing antibody responses to influenza PR8 virus. HI antibody titers (B) and PRNT50 titers (C) against the PR8 virus are shown. The detection limits of the HI assay and PRNT (dashed lines) were 8 and 50, respectively. (D) Protective efficacy against influenza PR8 virus. The vaccinated mice were challenged with 2 × 10³ PFU (2 MLD50) of wild type PR8 virus after the last vaccination, and the changes in weight and survival rates of the mice were monitored. Dashed line indicates humane endpoint which means losing 25% weight loss. Mice that lost >25% body weight were euthanized. Data of antibody titers (A–C) were log-transformed and expressed as means (horizontal lines) and scatter plots. Data of the changes in weight (D, left panel) are shown as means (points) and standard deviations (error bars). Repeated measures two-way ANOVA followed by Bonferroni’s post-test was used to analyze weight changes for different mouse groups over time. Each group was compared with the group given the non-adjuvanted GD (**P < 0.01; *P < 0.05).
Figure 3
Figure 3
Dose-dependent adjuvanticity of EGCG. PBS or 7 µg of HA antigens with or without adjuvant (70, 350, or 700 μg of EGCG) were injected into mice via IM route thrice every 2 weeks. (A) Vaccination, blood collection, and challenge schedule. (B) IgG antibody response to influenza PR8 virus. The antibody titer of each sample was expressed as the endpoint dilution with an absorbance value 2× greater than that of the PBS control group. Data were log-transformed and expressed as means (horizontal lines) and scatter plots. The detection limit (dashed line) was 400. (C, D) Neutralizing antibody responses to influenza PR8 virus. HI antibody titers (C) and PRNT50 titers (D) against the PR8 virus. Data were log-transformed and expressed as means (horizontal lines) and scatter plots. The detection limits of the HI assay and PRNT (dashed lines) were 8 and 25, respectively. (E) IgG antibody response to influenza PR8 virus depending on the number of vaccine doses. Data were log-transformed and expressed as means (bar graphs) and standard deviations (error bars). The detection limit (dashed line) was 400. (F) Neutralizing antibody responses to influenza PR8 virus depending on the number of vaccine doses. Data were log-transformed and expressed as means (bar graphs) and standard deviations (error bars). The detection limit (dashed line) was 25. (G) Protective efficacy against influenza PR8 virus. The vaccinated mice were challenged with 4 × 10³ PFU (4 MLD50) of influenza PR8 virus after the last vaccination. Dashed line indicates humane endpoint which means losing 25% weight loss. Mice that lost >25% body weight were euthanized. Data of the changes in weight (G, left panel) are shown as means (points) and standard deviations (error bars). Student’s t-test was used to compare two different groups. One-way ANOVA followed by Tukey’s multiple comparison test was conducted to compare three or more groups. Repeated measures two-way ANOVA followed by Bonferroni’s post-test was used to analyze weight changes for different mouse groups over time. Each group was compared with the group given the non-adjuvanted HA (**P < 0.01; *P < 0.05. ns, not significant).
Figure 4
Figure 4
Characterization of serum IgG antibody subclass elicited by EGCG-adjuvanted HA vaccine. PBS or 7 µg of HA antigens with or without adjuvant (30 μL of alum or 70, 350, or 700 μg of EGCG) were injected into mice via IM route thrice every 2 weeks. Sera were collected 2 weeks after the last vaccination. (A, B) IgG1 (A) and IgG2a (B) antibody responses to influenza PR8 virus. The antibody titer of each sample was expressed as the endpoint dilution with an absorbance value 2× greater than that of the PBS control group. Data were log-transformed and expressed as means (horizontal lines) and scatter plots. The detection limits (dashed lines) were 400. (C, D) IgG1 and IgG2a antibody responses to GD (C) or ST (D) of HA protein of influenza PR8 virus. Data were log-transformed and expressed as means (horizontal lines) and scatter plots. The detection limits (dashed lines) were 100. (E) IgG2a/IgG1 ratios of HA and EGCG-adjuvanted HA. The bar graphs indicate geometric means. For convenience, the IgG2a/IgG1 ratios were shown as log scale; corresponding to 12 fold (virus), 190 fold (GD), and 72 fold increase (ST) by EGCG. Student’s t-test was used to compare two different groups. One-way ANOVA followed by Tukey’s multiple comparison test was conducted to compare three or more groups (***P < 0.001; **P < 0.01; *P < 0.05. ns, not significant).
Figure 5
Figure 5
ADCC activity induced by EGCG against PR8 virus. PBS or 7 µg of HA antigens with or without adjuvant (30 μL of alum or 70, 350, or 700 μg of EGCG) were injected into mice thrice every 2 weeks. Sera were collected 2 weeks after the last vaccination. The sera were diluted 100× for the ADCC assay. Fold induction was defined as the increase in responses (number of times) compared to the negative control (reaction without mouse serum). Data are expressed as means (horizontal lines) and scatter plots. One-way ANOVA followed by Tukey’s multiple comparison test was conducted to compare three or more groups (*P < 0.05).
Figure 6
Figure 6
Synergistic effect of EGCG and alum. PBS or 7 µg of HA antigens with or without adjuvant (30 μL of alum, 70 μg of EGCG, or both alum and EGCG) were injected into mice thrice every 2 weeks. The overall experimental schedule was the same as presented in Figure 3A . (A–C) ELISA, HI assay, and PRNT were conducted to verify the synergistic relationship between EGCG and alum on vaccine immunogenicity. Data were log-transformed and expressed as means (horizontal lines) and scatter plots. (A) IgG antibody response to influenza PR8 virus. The antibody titer of each sample was expressed as the endpoint dilution with an absorbance value 2× greater than that of the PBS control group. The detection limit (dashed line) was 400. (B, C) Neutralizing antibody responses to influenza PR8 virus. HI antibody titers (B) and PRNT50 titers (C) against the PR8 virus. The detection limits of the HI assay and PRNT (dashed lines) were 8 and 25, respectively. (D) IgG antibody response to influenza PR8 virus depending on the number of vaccine doses. Data were log-transformed and expressed as means (bar graphs) and standard deviations (error bars). The detection limit (dashed line) was 400. (E) Neutralizing antibody responses to influenza PR8 virus depending on the number of vaccine doses. Data were log-transformed and expressed as means (bar graphs) and standard deviations (error bars). The detection limit (dashed line) was 25. (F) Protective efficacy against influenza PR8 virus. Mice were challenged with 4 × 10³ PFU (4 MLD50) of influenza PR8 virus after the last vaccination. Dashed line indicates humane endpoint which means losing 25% weight loss. Mice that lost >25% body weight were euthanized. Data of the changes in weight (F, left panel) are shown as means (points) and standard deviations (error bars). One-way ANOVA followed by Tukey’s multiple comparison test was conducted to compare three or more groups. Repeated measures two-way ANOVA followed by Bonferroni’s post-test was used to analyze weight changes for different mouse groups over time. Each group was compared with the group given the non-adjuvanted HA (**P < 0.01; *P < 0.05. ns, not significant).
Figure 7
Figure 7
Adjuvant effect of EGCG to other types of vaccine. (A) Vaccination and blood collection schedule for FAiV. PBS or 2 × 10⁶ PFU of FAiV with or without EGCG were injected into mice via IP route twice every 3 weeks. Sera were collected 3 weeks after the last vaccination. (B) Vaccination and blood collection schedule for Kovax is shown. PBS or 6 μg of Kovax (1.5 μg of each antigen derived from four different strains) with or without EGCG were injected into mice via IM route once. Sera were collected 3 weeks after the vaccination. (C) Total IgG, IgG1, and IgG2a antibody responses or neutralizing antibody responses to influenza PR8 virus. The detection limit of ELISA antibody and PRNT50 titers (dashed lines) were 800 and 25, respectively. (D) Serum IgG titers specific for four different influenza strains are shown. The detection limits (dashed lines) were 100. Data of antibody titers (C, D) were log-transformed and expressed as means (bar graphs) and standard deviations (error bars). Student’s t-test was used to compare two different groups (**P < 0.01; *P < 0.05).

References

    1. Mascola JR, Fauci AS. Novel Vaccine Technologies for the 21st Century. Nat Rev Immunol (2020) 20(2):87–8. doi: 10.1038/s41577-019-0243-3 - DOI - PMC - PubMed
    1. Reed SG, Orr MT, Fox CB. Key Roles of Adjuvants in Modern Vaccines. Nat Med (2013) 19(12):1597–608. doi: 10.1038/nm.3409 - DOI - PubMed
    1. Schijns VE, Lavelle EC. Trends in Vaccine Adjuvants. Expert Rev Vaccines (2011) 10(4):539–50. doi: 10.1586/erv.11.21 - DOI - PubMed
    1. Slutter B, Bal SM, Ding Z, Jiskoot W, Bouwstra JA. Adjuvant Effect of Cationic Liposomes and CpG Depends on Administration Route. J Control Release (2011) 154(2):123–30. doi: 10.1016/j.jconrel.2011.02.007 - DOI - PubMed
    1. Weinberger B. Adjuvant Strategies to Improve Vaccination of the Elderly Population. Curr Opin Pharmacol (2018) 41:34–41. doi: 10.1016/j.coph.2018.03.014 - DOI - PubMed

Publication types

MeSH terms