. 2021 Nov 18:12:770742.
doi: 10.3389/fgene.2021.770742. eCollection 2021.

Transcriptome Profiling of the Salt Stress Response in the Leaves and Roots of Halophytic Eutrema salsugineum

Affiliations

Transcriptome Profiling of the Salt Stress Response in the Leaves and Roots of Halophytic Eutrema salsugineum

Chuanshun Li et al. Front Genet. .

Abstract

Eutrema salsugineum can grow in natural harsh environments; however, the underlying mechanisms for salt tolerance of Eutrema need to be further understood. Herein, the transcriptome profiling of Eutrema leaves and roots exposed to 300 mM NaCl is investigated, and the result emphasized the role of genes involved in lignin biosynthesis, autophagy, peroxisome, and sugar metabolism upon salt stress. Furthermore, the expression of the lignin biosynthesis and autophagy-related genes, as well as 16 random selected genes, was validated by qRT-PCR. Notably, the transcript abundance of a large number of lignin biosynthesis genes such as CCoAOMT, C4H, CCR, CAD, POD, and C3'H in leaves was markedly elevated by salt shock. And the examined lignin content in leaves and roots demonstrated salt stress led to lignin accumulation, which indicated the enhanced lignin level could be an important mechanism for Eutrema responding to salt stress. Additionally, the differentially expressed genes (DEGs) assigned in the autophagy pathway including Vac8, Atg8, and Atg4, as well as DEGs enriched in the peroxisome pathway such as EsPEX7, EsCAT, and EsSOD2, were markedly induced in leaves and/or roots. In sugar metabolism pathways, the transcript levels of most DEGs associated with the synthesis of sucrose, trehalose, raffinose, and xylose were significantly enhanced. Furthermore, the expression of various stress-related transcription factor genes including WRKY, AP2/ERF-ERF, NAC, bZIP, MYB, C2H2, and HSF was strikingly improved. Collectively, the increased expression of biosynthesis genes of lignin and soluble sugars, as well as the genes in the autophagy and peroxisome pathways, suggested that Eutrema encountering salt shock possibly possess a higher capacity to adjust osmotically and facilitate water transport and scavenge reactive oxidative species and oxidative proteins to cope with the salt environment. Thus, this study provides a new insight for exploring the salt tolerance mechanism of halophytic Eutrema and discovering new gene targets for the genetic improvement of crops.

Keywords: Eutrema salsugineum; RNA-seq; autophagy; lignin biosynthesis; peroxisome; salt shock; sugar metabolism; transcription factor.


Conflict of interest statement

The authors declare that the research was conducted in the absence of any commercial or financial relationships that could be construed as a potential conflict of interest.

Figures

FIGURE 1
FIGURE 1
Analysis of differentially expressed genes in Eutrema upon 300 mM NaCl. (A) Numbers of differentially expressed genes (DEGs). (B) Venn diagram demonstrated the common and specific DEGs in roots and leaves. (C) Heatmap demonstrated the distinguished expression patterns of DEGs. The transcript levels calculated as RPKM are shown in the color legend.
FIGURE 2
FIGURE 2
Function analysis of DEGs in Eutrema under salt stress. (A) Histogram of GO terms in leaves and roots of Eutrema. (B) Top 20 KEGG pathways in leaves. (C) Top 20 KEGG pathways in roots. The rich factor is the ratio of numbers of DEGs to a total of annotated genes in a certain pathway. The color of dots represents the significance of DEGs in specific pathways, and the smaller q-value indicates higher significance. The size of dots indicates the numbers of DEGs enriched.
FIGURE 3
FIGURE 3
Validation of RNA-seq result using quantitative real-time PCR. (A) Expression verification of 16 genes in RNA-seq by qRT-PCR. Black bars indicate log2FC of DEGs in RNA-seq, and white bars show −ΔΔCT of DEGs in qRT–PCR. Correlation analysis of results between RNA-seq and qRT–PCR in leaves (B) and roots (C). The data of log2FC (Y-axis) were obtained by RNA-seq, and -ΔΔCT (X-axis) was analyzed by qRT-PCR. The Ubiquitin gene (Thhalv10000782m) was used as an internal control. Each set of data were obtained from three repeats.
FIGURE 4
FIGURE 4
Analysis of transcription factors responding to salt stress in leaves and roots in Eutrema. (A) Number distribution of up/downregulated TF families in responsive to salt stress in leaves (left bars) and roots (right bars). The red or orange color indicates the upregulated genes, and the blue or green color indicates the downregulated genes. (B) Heatmap analysis of DEGs in top 9 TF families with higher numbers. The differential transcript levels calculated as log2 (NaCl/CK) are shown in the color legend, and the red color indicates upregulated genes, and the blue indicates downregulated genes. The various color bars represent different TF families.
FIGURE 5
FIGURE 5
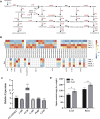
Expression analysis of DEGs enriched in the lignin biosynthesis pathway, and lignin content change under salt stress. (A) DEGs enriched in the lignin biosynthesis pathway in leaves. PAL, phenylalanine ammonia-lyase; C4H, cinnamic acid 4-hydroxylase; C3′H, p-coumaroyl shikimate 3′-hydroxylase; COMT, caffeate 3-O-methyltransferase; F5H, ferulate 5-hydroxylase; 4CL, 4-coumaric acid: CoA ligase; HCT, hydroxycinnamoyl CoA: shikimate/quinate hydroxycinnamoyl transferase; CCR, cinnamoyl CoA reductase; CAD, cinnamyl alcohol dehydrogenase; POX, peroxidase; and LAC, laccase. (B) Heatmap analysis of DEGs enriched in the lignin biosynthesis pathway in leaves and roots. The transcript levels calculated as RPKM are shown in the color legend. (C) Relative expression (2−ΔΔCT) of lignin biosynthesis genes in NaCl-treated Eutrema leaves was determined using quantitative real-time PCR. The Ubiquitin gene (Thhalv10000782m) was used as an internal control. Each set of data were obtained from three repeats. (D) Lignin content of leaves and roots in salt-treated and normal growth Eutrema plants.
FIGURE 6
FIGURE 6
DEGs enriched in pathways of autophagy and peroxisome, and heatmap analysis of DEGs. (A) DEGs enriched in the autophagy pathway. MAPK, mitogen-activated protein kinase; mTOR, mammalian target of rapamycin; ATG, autophagy-related protein; VAC, vacuolar membrane protein; and VPS, vacuolar protein sorting. (B) Heatmap analysis of DEGs of leaves enriched in the autophagy pathway. The transcript levels calculated as RPKM are shown in the color legend. (C) Relative expression (2−ΔΔCT) of autophagy-related biosynthesis genes in NaCl-treated Eutrema leaves determined by qRT-PCR. The Ubiquitin gene (Thhalv10000782m) was used as an internal control. Each set of data were obtained from three repeats. (D) DEGs enriched in the peroxisome pathway. PEX, peroxin; PTS, peroxisome targeting signal; CAT, catalase; SOD, superoxidase dismutase; INOS, nitric oxide synthases; PRDX, peroxiredoxin; HPCL, 2-hydroxyacyl-CoA lyase; ACOX, acyl-coA oxidase; ACAA, acetyl-CoA acyltransferase; PMP, peroxisomal membrane protein. (E) Heatmap analysis of DEGs enriched in the peroxisome pathway. The transcript levels calculated as RPKM are shown in the color legend.
FIGURE 7
FIGURE 7
Schematic view of genes participating in starch and carbohydrate metabolism and heatmap analysis of DEGs. (A) The schematic view of genes participating in carbohydrate metabolism. XYL4, xylan 1,4-beta-xylosidase; IRX, 1,4-beta-D-xylan synthase; GAUT, galacturonosyltransferase; GAE, UDP-glucuronate 4-epimerase; SS, sucrose synthetase; SPS, sucrose phosphate synthetase; TPS, trehalose-6-phosphate synthase; TPP, trehalose-6-phosphate phosphatase; lacZ, beta-galactosidase; AKR1B, aldehyde reductase; GLA, alpha-galactosidase; RFS, raffinose synthase; glgA, glycogen synthase; glgC, glucose-1-phosphate adenylyltransferase; GALE, UDP-glucose 4-epimerase; pgm, phosphoglucomutase; FBA, fructose-bisphosphate aldolase; FBP, fructose-1,6-bisphosphate phosphatase; PMM, phosphomannomutase; TPI, triosephosphate isomerase; GMPP, mannose-1-phosphate guanylyltransferase; SORD, L-iditol 2-dehydrogenase. (B) Heatmap analysis of DEGs enriched in pathways of carbohydrate metabolism. The transcript levels calculated as RPKM are shown in the color legend.
FIGURE 8
FIGURE 8
Phylogenetic analysis of LEA proteins and heatmap exhibited the expression of DEGs. (A) Phylogenetic analysis of LEA proteins. Red triangles represent the significantly upregulated LEA genes both in leaves and roots; blue triangles represent the LEA gene markedly downregulated in leaves and upregulated in roots. Red circles indicate significantly upregulated LEA genes only in leaves; blue circles indicate markedly downregulated LEA genes only in leaves. LEA, late embryogenesis abundant; SMP, seed maturation protein; Dehydrin, dehydrin protein. (B) Heatmap analysis of markedly differential LEA genes expression. The transcript levels calculated as RPKM are shown in the color legend.
FIGURE 9
FIGURE 9
Proposed model for the mechanism of Eutrema responding to salt stress. AP2/ERF, APETALA 2/ethylene-responsive element binding factor; MYB, v-myb avian myeloblastosis viral oncogene homolog; WRKY, WRKY transcription factors; NAC, NAM, ATAF and CUC family; bZIP, basic leucine zipper; and bHLH, basic helix-loop-helix. ATG, autophagy-related protein; VAC, vacuolar membrane protein; SOD, superoxidase dismutase; CAT, catalase; MPV17, Mpv17 protein; ACOX, acyl-coA oxidase; ACAA, acetyl-CoA acyltransferase; HACL/HPCL, 2-hydroxyacyl-CoA lyase; PEX, peroxin; PAL, phenylalanine ammonia-lyase; C4H, cinnamic acid 4-hydroxylase; 4CL, 4-coumaric acid: CoA ligase; CCR, cinnamoyl CoA reductase; CAD, cinnamyl alcohol dehydrogenase; POD/POX, peroxidase; C3′H, p-coumaroyl shikimate 3′-hydroxylase; COMT, caffeate 3-O-methyltransferase; CCoAOMT, caffeoyl-CoA O-methyltransferase; TPS, trehalose-6-phosphate synthase; TPP, trehalose-6-phosphate phosphatase; IRX, 1,4-beta-D-xylan synthase; XYL4, xylan 1,4-beta-xylosidase; lacZ, beta-galactosidase; AKR1B, aldehyde reductase; GLA, alpha-galactosidase; RFS, raffinose synthase; glgA, glycogen synthase; glgC, glucose-1-phosphate adenylyltransferase; LEA, Late embryogenesis abundant; Dehydrin, dehydrin protein.
FIGURE 10
FIGURE 10
DEGs enriched in pathways of photosynthesis and ribosome in leaves. (A) Heatmap analysis of DEGs enriched in the photosynthesis pathway. PET indicates the photosynthetic electron transport. The transcript levels calculated as RPKM are shown in the color legend. (B) Heatmap analysis of DEGs enriched in the ribosome pathway. The transcript levels calculated as RPKM are shown as in the color legend.

Similar articles

Cited by

References

    1. Ali M. A., Azeem F., Nawaz M. A., Acet T., Abbas A., Imran Q. M., et al. (2018). Transcription Factors WRKY11 and WRKY17 Are Involved in Abiotic Stress Responses in Arabidopsis . J. Plant Physiol. 226, 12–21. 10.1016/j.jplph.2018.04.007 - DOI - PubMed
    1. Allakhverdiev S. I., Murata N. (2008). Salt Stress Inhibits Photosystems II and I in Cyanobacteria . Photosynth Res. 98 (1), 529–539. 10.1007/s11120-008-9334-x - DOI - PubMed
    1. Amtmann A. (2009). Learning from Evolution: Thellungiella Generates New Knowledge on Essential and Critical Components of Abiotic Stress Tolerance in Plants. Mol. Plant. 2 (1), 3–12. 10.1093/mp/ssn094 - DOI - PMC - PubMed
    1. Apel K., Hirt H. (2004). Reactive Oxygen Species: Metabolism, Oxidative Stress, and Signal Transduction. Annu. Rev. Plant Biol. 55, 373–399. 10.1146/annurev.arplant.55.031903.141701 - DOI - PubMed
    1. Arai Y., Hayashi M., Nishimura M. (2008). Proteomic Identification and Characterization of a Novel Peroxisomal Adenine Nucleotide Transporter Supplying ATP for Fatty Acid β-Oxidation in Soybean and Arabidopsis. Plant Cell 20 (12), 3227–3240. 10.1105/tpc.108.062877 - DOI - PMC - PubMed