

Computed Tomography-Based Body Composition in Patients With Ovarian Cancer: Association With Chemotoxicity and Prognosis
- PMID: 34868915
- PMCID: PMC8634936
- DOI: 10.3389/fonc.2021.718815
Computed Tomography-Based Body Composition in Patients With Ovarian Cancer: Association With Chemotoxicity and Prognosis
Abstract
Purpose: To assess the association between computed tomography (CT)-derived quantitative measures of body composition profiling and chemotherapy-related complications, in terms of dose reduction, premature discontinuation of chemotherapy, and cycle delays in patients with ovarian cancer. Secondary purposes were to evaluate associations between sarcopenia and survival, and to evaluate differences in body composition profiling at baseline and after neoadjuvant chemotherapy.
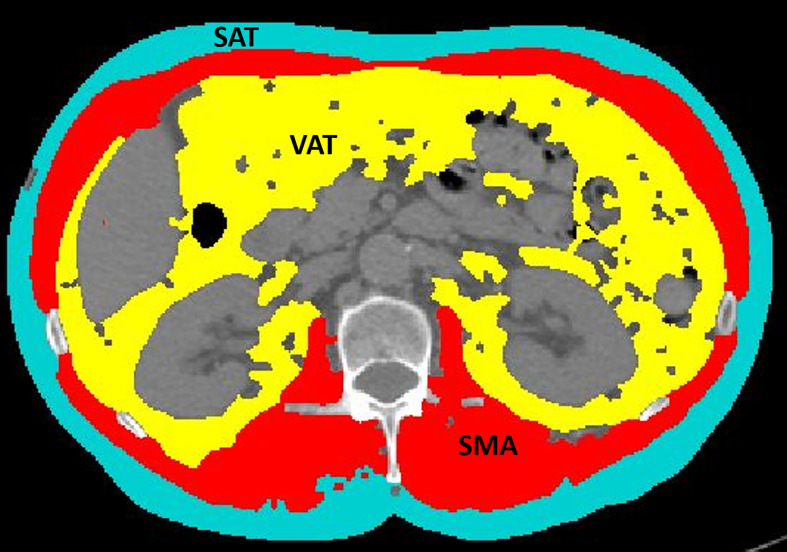
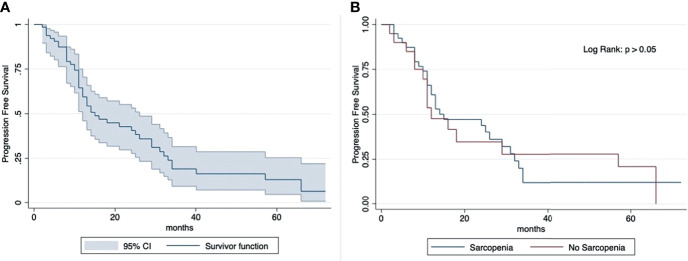
Materials and methods: The study population was retrospectively selected from a database of patients with newly diagnosed ovarian cancer (any stage) referred to our Institution between Feb 2011 and Mar 2020. Clinical data were recorded, and CT images at the level of the 3rd lumbar vertebra were stored. By using specific software, skeletal muscle area (SMA), subcutaneous adipose tissue (SAT), visceral adipose tissue (VAT), and skeletal muscle density (SMD) were extracted. Skeletal muscle index (SMI) was then calculated. Statistical analysis was performed by logistic regression models to identify body composition features predictive of dose reduction, premature end of chemotherapy, and cycle delays. Kaplan-Meier analyses were performed to assess overall survival (OS) and progression-free survival (PFS). The log-rank test was used to determine differences in OS and PFS between sarcopenic and non-sarcopenic patients. Wilcoxon test was performed to compare body composition features before and after neoadjuvant chemotherapy (NACT).
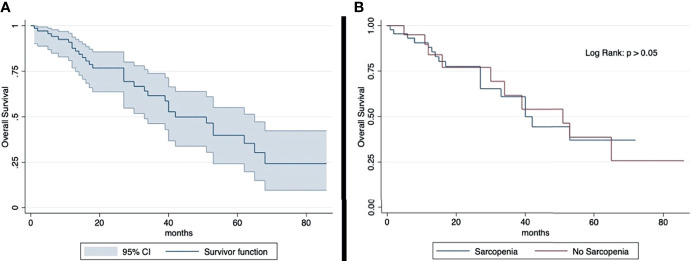
Results: Sixty-nine patients were included. A significant association was found between VAT and cycle delays (OR = 1.01, z = 2.01, 95% CI: 1.00-1.02, p < 0.05), between SMA and early discontinuation of chemotherapy (OR = 1.03, z = 2.10, 95% CI: 1.00-1.05, p < 0.05), and between mean SMD and cycle delays (OR = 0.92, z = -2.70, 95%CI: 0.87-0.98, p < 0.01). No significant difference emerged for OS in sarcopenic and non-sarcopenic patients, nor in CT body composition features before and after NACT.
Conclusions: In ovarian cancer patients, CT-derived body composition profiling might predict the risk of chemotoxicity. In particular, VAT and SMD are associated with chemotherapy cycle delays, and SMA with early discontinuation of chemotherapy.
Keywords: body composition; chemotherapy; ovarian cancer; skeletal muscle area; visceral adipose tissue.
Copyright © 2021 Del Grande, Rizzo, Nicolino, Colombo, Rossi, Manganaro and Del Grande.
Conflict of interest statement
The authors declare that the research was conducted in the absence of any commercial or financial relationships that could be construed as a potential conflict of interest.
Figures
References
-
- Colombo N, Sessa C, Bois AD, Ledermann J, McCluggage WG, McNeish I, et al. ESMO-ESGO Consensus Conference Recommendations on Ovarian Cancer: Pathology and Molecular Biology, Early and Advanced Stages, Borderline Tumours and Recurrent Disease. Ann Oncol (2019) 30(5):672–705. doi: 10.1093/annonc/mdz062 - DOI - PubMed
LinkOut - more resources
Full Text Sources
Research Materials
Miscellaneous