. 2021 Nov 11:11:761693.
doi: 10.3389/fonc.2021.761693. eCollection 2021.

The Clinical Significance and Transcription Regulation of a DNA Damage Repair Gene, SMC4, in Low-Grade Glioma via Integrated Bioinformatic Analysis

Affiliations

The Clinical Significance and Transcription Regulation of a DNA Damage Repair Gene, SMC4, in Low-Grade Glioma via Integrated Bioinformatic Analysis

Yan Wang et al. Front Oncol. .

Abstract

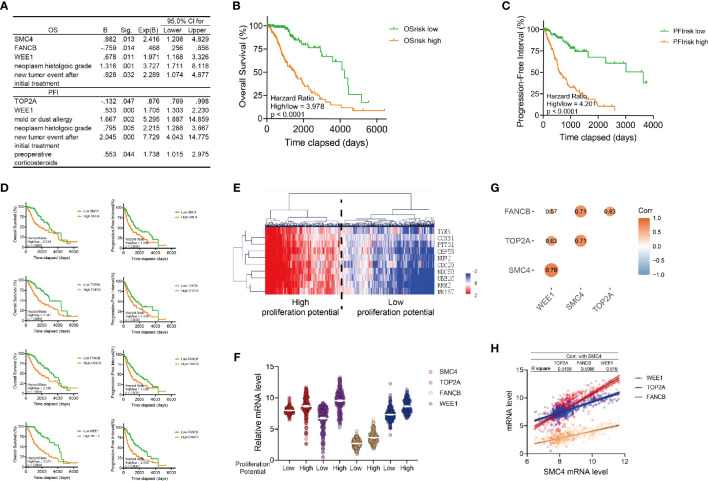
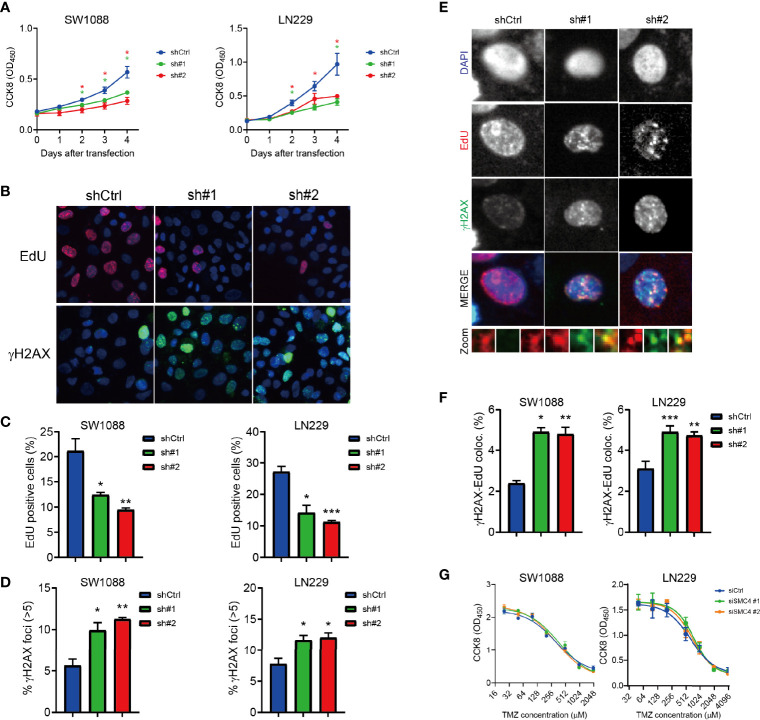
Glioma is the most common type of malignant tumor in the central nervous system with an unfavorable prognosis and limited treatment. In this study, we are devoted to addressing the prognostic value of DNA damage repair-related genes in low-grade glioma (LGG). We plotted the landscape of DNA damage repair (DDR)-related genes and identified SMC4 as an independent prognostic marker with integrated bioinformatics analysis, which is overexpressed in different histologic subtypes of glioma. We observed that SMC4 expression is elevated in recurrent LGG patients or those with advanced histologic staging. SMC4 depletion inhibits proliferation and induces increased replication damage in LGG cells. Lastly, we predicted and validated the transcription modulation of SMC4 by a transcription factor, MYB, at the -976bp~ -837bp of the SMC4 promoter region in LGG cells. Together, our study identified SMC4 as a potential prognostic biomarker for LGG patients, which functions to promote cell proliferation by repairing replication damage and the expression of SMC4 could be transcriptionally regulated by MYB.

Keywords: DNA damage repair; SMC4; bioinformatic; low-grade glioma; transcriptional modulation.


Conflict of interest statement

The authors declare that the research was conducted in the absence of any commercial or financial relationships that could be construed as a potential conflict of interest.

Figures

Figure 1
Figure 1
The DNA damage repair landscape of low-grade glioma patients in TCGA database. (A) Heatmap and Hierarchical Clustering showing the heterogenous expression of 360 DNA damage repair-related genes in 530 glioma patients in the TCGA database. A sub-cluster of highly homogeneously expressed genes is marked in the red square. (B) Top: heatmap and Hierarchical Clustering of the glioma patients with 37 DNA damage repair signature genes (n = 530) from Figure 1A . Patients can be divided into high or low DDR level group according to the Hierarchical Clustering result. Bottom: vital status of the glioma patients with different DNA damage repair levels as presented in the top figure (n = 530). Deceased patients are labeled in red and censored/living patients are labeled in blue. (C) Kaplan-Meier analysis showing the OS, DSS, DFI and PFI of glioma patients with high vs. low DNA damage repair level according to the median (nhigh = 265, nlow = 265). (D) Bubble diagram showing the KEGG and GO analysis results (including GO_BP, GO_MF and GO_CC) for 37 DNA damage repair signature genes. The size of each point represents the number of genes in the representative pathway. DDR, DNA Damage Repair; OS, Overall Survival; DSS, Disease-Specific Survival; DFI, Disease-Free Interval; PFI, Progression-Free Interval; GO, Gene Ontology; BP, biological process; CC, cellular component; MF, molecular function; KEGG, Kyoto Encyclopedia of Genes and Genomes.
Figure 2
Figure 2
Identification of SMC4 as a prognostic marker of low-grade glioma patients. (A) Table showing the results of the multivariate Cox Regression for the OS (the top table) or PFI (the bottom table) of LGG patients in TCGA database with Forward Stepwise method in SPSS. Genes or clinical signatures identified as risk factors are listed in the table. The B factor, p value (Sig.), expected B factor (with 95% CI) are provided for each risk factor. (B, C) Kaplan-Meier analysis comparing the OS (B) and PFI (C) of high or low risk LGG patients. 530 patients were enrolled and divided into high/low-risk groups according to the median of OS risk score or PFI risk score (nhigh = 265, nlow = 265). (D) Kaplan-Meier analysis comparing the OS and PFI in glioma patients according to the expression levels of SMC4, TOP2A, FANCB and WEE1. 530 patients were enrolled and divided into high/low-risk groups according to the median of their respective risk score (nhigh = 265, nlow = 265). (E) Heatmap and Hierarchical Clustering showing the proliferation potency of glioma patients. Patients were divided into high or low proliferative potential group according to the Hierarchical Clustering results. Proliferation markers are TYMS, CCNB1, PTTG1, CEP55, NUF2, CDC20, NDC80, UBE2C, RRM2 and MKI67. (F) Violin plot showing the expression of SMC4, TOP2A, FANCB and WEE1 in high/low proliferative LGG patients (n = 530). High or low expression levels are defined with the median. (G) The correlation between SMC4, TOP2A, FANCB and WEE1 mRNA levels in LGG patients from TCGA database (n = 530). The size and color of each dot represents correlation coefficient. (H) Dot plot and linear regression showing the correlation between the SMC4 mRNA and the WEE1, TOP2A or FANCB mRNA (n = 530). The R square of linear regression model is labeled in the table above the figure. OS, Overall Survival; PFI, Progression-Free Interval; LGG, lower-grade glioma.
Figure 3
Figure 3
The expression of SMC4 in glioma patients. (A) The expression of SMC4 in 32 different cancer types in the GEPIA database. (B, C) The expression of SMC4 in normal tissues (B) or primary/recurrent tumor tissues (C) from the GTEX database. (D) Kaplan-Meier analysis comparing the OS and PFI in glioma patients with different histologic origins (n = 97, 75 and 114 for astrocytoma, oligoastrocytoma and oligodendroglioma respectively). Patients were divided into two groups according to SMC4 expression level. (E) Violin plot showing the expression of SMC4 in glioma patients with the different first-course responses (the left panel), new tumor events (the middle panel), or histologic staging (the right panel). (F) Violin plot showing the expression of SMC4 in glioma patients with different symptoms (the left panel), tumor location (the middle panel), or supratentorial location (the right panel). (G) Tables showing the results from the multivariate Cox Regression model for the OS (the left panel) or the PFI (the right panel) with SMC4 and different clinical features in LGG patients. (H) Kaplan-Meier analysis comparing the OS and PFI of SMC4 high or low-expressing LGG patients, with or without new tumor events (the top panel) or patients from different histologic staging (the bottom panel). OS, Overall Survival; PFI, Progression-Free Interval; LGG, lower-grade glioma. ****p < 0.0001.
Figure 4
Figure 4
SMC4 expression in patients with different molecular subtypes (A) Volcano plot showing the GSEA result comparing the enrichment score (E.S.) of different KEGG (the left panel) or GO (the right panel) pathways in glioma patients with high vs. low SMC4 levels. Up-regulated pathways are labeled in red and down-regulated pathways labeled in blue. (B, C) GSEA results showing the top 3 activated (the top panel) or suppressed pathways (the bottom panel) in KEGG (B) or GO (C) pathways. (D) Dot plot showing the correlation between SMC4 mRNA level and telomere length calculated with LPS or WGS methods (the left panel) or stemness score (the right panel) calculated based on mRNA or DNA level. The linear regression model with 95% CI were plotted. (E) Violin plot showing the expression of SMC4 mRNA in LGG patients with different immune subtypes. (F) Bar plot showing the expression of SMC4 mRNA in LGG patients with IDH mutation (the left panel) or 1p19q co-deletion (the right panel). (G) Dot plot showing the correlation between SMC4 mRNA and MGMT mRNA in LGG patients. Linear regression and 95% CI are shown in black. (H) Kaplan-Meier analysis comparing the survival of high vs. low SMC4 in low-MGMT expressing (the left panel) or high MGMT-expressing LGG patients (the right panel). (I) Dot plot showing the correlation between the IC50 of TMZ and SMC4 expression level in different LGG cell lines. Linear regression and 95% CI are shown in black. (J) Dot plot showing the expression level of SMC4 mRNA in LGG patients undergoing chemotherapy (the right panel) or radiotherapy (the left panel) with different outcomes. GO, Gene Ontology; LGG, lower-grade glioma. ****p < 0.0001.
Figure 5
Figure 5
(A) Proliferation assay showing reduced proliferation of SMC4 depleted SW1088 and LN229 cells with Cell Counting Kit 8 (CCK8). OD450 was measured to quantify cell number in each group. Results from 3 different experiments. (B–D) Typical figures (B) and quantification (C, D) of the EdU staining (B, the top panel and C) and γH2AX staining (B, the bottom panel and D) in the control or SMC4 depleted SW1088 and LN229 cells. EdU (red) and γH2AX (green) were detected with immunofluorescence. Result from 3 different experiments. (E, F) Typical figures (E) and quantification (F) of EdU- γH2AX colocalization in the control or SMC4 depleted SW1088 or LN229 cells. EdU (red) and γH2AX (green) were detected with immunofluorescence. Results from 3 different experiments. (G) Dose-response analysis comparing the sensitivity of SMC4-depleted SW1088 and LN229 cells to temozolomide (TMZ) after 3 days with CCK8. OD450 was measured to quantify cell number in each group. Results from 3 different experiments. Data were represented as mean ± SEM. *p < 0.05; **p < 0.01; ***p < 0.001. The data were analyzed using Student’s t-test.
Figure 6
Figure 6
The transcriptional modulation of SMC4. (A) Violin plot showing the relative methylation status of SMC4 DNA in glioma patients. (B) Dot plot showing the significant correlation between the methylation status and mRNA level of SMC4. cg12785694, cg13783238 and cg04212239 are shown in orange, red or blue. (C) Kaplan-Meier analysis comparing the OS and PFI in patients with different SMC4 methylation statuses. Methylation level of cg04212239 (the left panel), cg13783238 (the middle panel) or cg12785694 (the right panel) are analyzed. (D) Dot plot showing predicted binding sites on SMC4 promoter region from PROMO database and the correlation between predicted targets and SMC4 level in glioma patients in TCGA database. Pearson correlation -0.5< r <0.5 are labeled in grey; negative correlations (r < -0.5) are labeled in blue and positive correlations (r > 0.5) are labeled in red. (E) Dot plot showing the binding site of different targets on SMC4 promoter and its dis-similarity. (F, G) Dot plot showing the correlation between SMC4 level and the expression of THRA, E2F1 and MYB in TCGA database (F) or GEPIA database (G). (H) Quantification of SMC4 and MYB mRNA level in MYB overexpressed SW1088 and LN229 cells with qPCR. GAPDH is used as an internal control for the analysis. Results from 3 different experiments. (I) The top panel: quantification of fold enrichment at the promoter region of SMC4 with ChIP-qPCR. The bottom panel: quantification of SMC4 transcription (-800bp~-1000bp) activity with dual-luciferase assay in SW1088 and LN229 cells. Results from 3 different experiments. Data were represented as mean ± SEM. *p<0.05; **p<0.01. The data were analyzed using Student’s t-test.

Similar articles

Cited by

References

    1. Yan H, Parsons DW, Jin G, McLendon R, Rasheed BA, Yuan W, et al. . IDH1 and IDH2 Mutations in Gliomas. N Engl J Med (2009) 360:765–73. doi: 10.1056/NEJMoa0808710 - DOI - PMC - PubMed
    1. Youssef G, Miller JJ. Lower Grade Gliomas. Curr Neurol Neurosci Rep (2020) 20:21. doi: 10.1007/s11910-020-01040-8 - DOI - PMC - PubMed
    1. Ostrom QT, Gittleman H, Truitt G, Boscia A, Kruchko C, Barnholtz-Sloan JS. CBTRUS Statistical Report: Primary Brain and Other Central Nervous System Tumors Diagnosed in the United States in 2011-2015. Neuro Oncol (2018) 20:iv1–iv86. doi: 10.1093/neuonc/noy131 - DOI - PMC - PubMed
    1. Paolillo M, Boselli C, Schinelli S. Glioblastoma Under Siege: An Overview of Current Therapeutic Strategies. Brain Sci (2018) 8(1):15. doi: 10.3390/brainsci8010015 - DOI - PMC - PubMed
    1. Stupp R, Mason WP, van den Bent MJ, Weller M, Fisher B, Taphoorn MJ, et al. . Radiotherapy Plus Concomitant and Adjuvant Temozolomide for Glioblastoma. N Engl J Med (2005) 352:987–96. doi: 10.1056/NEJMoa043330 - DOI - PubMed

LinkOut - more resources