

Predictors of SARS-CoV-2 Infection in Youth at a Large, Urban Healthcare Center in California, March-September 2020
- PMID: 34869107
- PMCID: PMC8635702
- DOI: 10.3389/fped.2021.752247
Predictors of SARS-CoV-2 Infection in Youth at a Large, Urban Healthcare Center in California, March-September 2020
Abstract
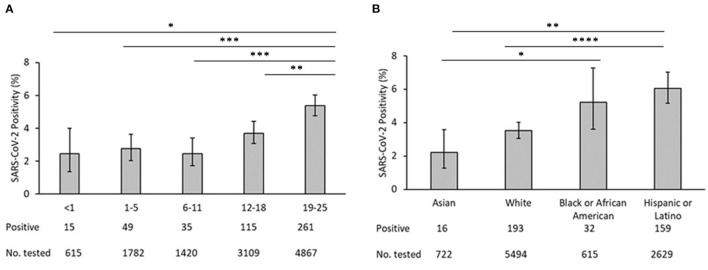
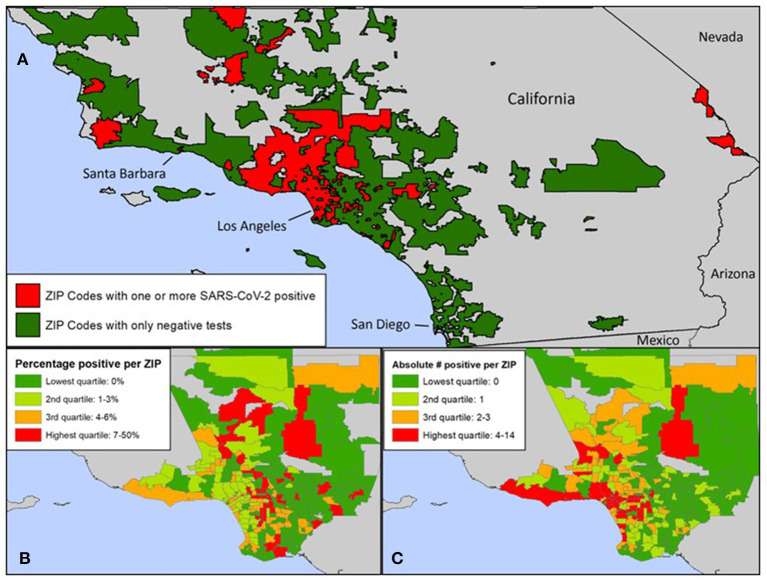
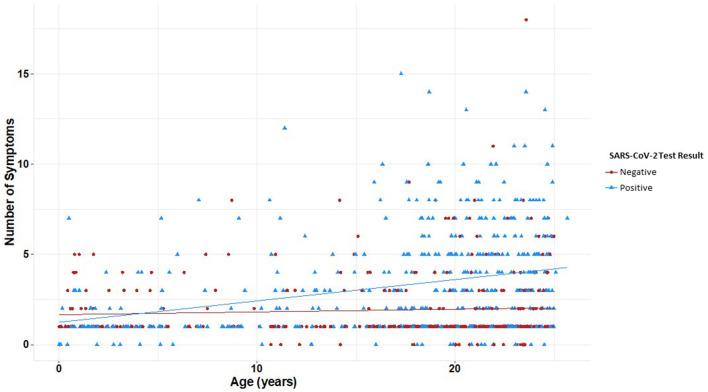
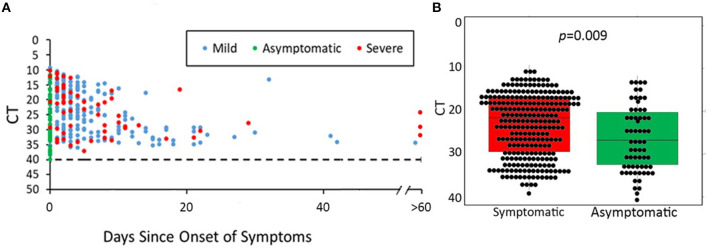
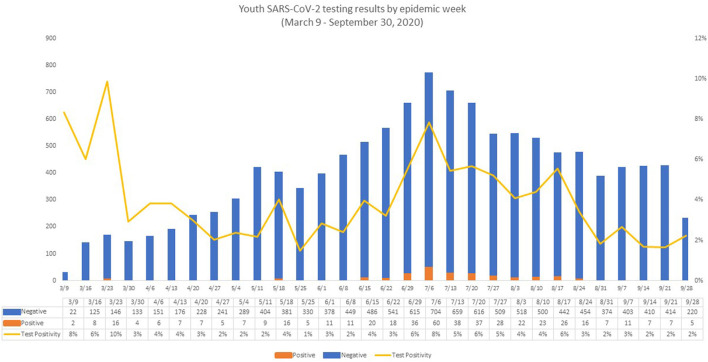
Objective: To understand which social, epidemiologic, and clinical risk factors are associated with SARS-CoV-2 infection in youth accessing care in a large, urban academic institution. Methods: We conducted a prospective cohort study with case-control analyses in youth who received testing for SARS-CoV-2 at our academic institution in Los Angeles during the first wave of the COVID-19 pandemic (March-September 2020). Results: A total of 27,976 SARS-CoV-2 assays among 11,922 youth aged 0-24 years were performed, including 475 youth with positive SARS-CoV-2 results. Positivity rate was higher among older, African American, and Hispanic/Latinx youth. Cases were more likely to be from non-English-speaking households and have safety-net insurance. Zip codes with higher proportion of Hispanic/Latinx and residents living under the poverty line were associated with increased SARS-CoV-2 cases. Youth were more likely to have positive results if tested for exposure (OR 21.5, 95% CI 14.6-32.1) or recent travel (OR 1.5, 95% CI 1.0-2.3). Students were less likely to have positive results than essential worker youth (OR 0.5, 95% CI 0.3-0.8). Patterns of symptom presentation varied significantly by age group; number of symptoms correlated significantly with age in SARS-CoV-2 cases (r = 0.030, p < 0.001). SARS-CoV-2 viral load did not vary by symptom severity, but asymptomatic youth had lower median viral load than those with symptoms (21.5 vs. 26.7, p = 0.009). Conclusions: Socioeconomic factors are important drivers of SARS-CoV-2 infection in youth. Presence of symptoms, exposure, and travel can be used to drive testing in older youth. Policies for school reopening and infection prevention should be tailored differently for elementary schools and universities.
Keywords: COVID-19; LA County; SARS-CoV-2; testing; viral load; youth.
Copyright © 2021 Newhouse, Saleh, Fuller, Kerin, Cambou, Swayze, Le, Seo, Trejo, Garner, Chandrasekaran and Nielsen-Saines.
Conflict of interest statement
The authors declare that the research was conducted in the absence of any commercial or financial relationships that could be construed as a potential conflict of interest.
Figures
Similar articles
-
Clinical and epidemiological characteristics of SARS-CoV-2 Infection in Los Angeles County youth during the first year of the pandemic.Int J Infect Dis. 2022 Sep;122:514-520. doi: 10.1016/j.ijid.2022.06.040. Epub 2022 Jul 6. Int J Infect Dis. 2022. PMID: 35803467 Free PMC article.
-
Epidemiology and SARS-CoV-2 Infection Patterns among Youth Followed at a Large Los Angeles Health Network during 2020-2022: Clinical Presentation, Prevalent Strains, and Correlates of Disease Severity.Vaccines (Basel). 2023 May 25;11(6):1024. doi: 10.3390/vaccines11061024. Vaccines (Basel). 2023. PMID: 37376413 Free PMC article.
-
Dialysis, COVID-19, Poverty, and Race in Greater Chicago: An Ecological Analysis.Kidney Med. 2020 Sep-Oct;2(5):552-558.e1. doi: 10.1016/j.xkme.2020.06.005. Epub 2020 Jul 30. Kidney Med. 2020. PMID: 32838290 Free PMC article.
-
COVID-19: Highlighting Health Disparities in the Los Angeles Latinx Community.Clin Med Res. 2021 Dec;19(4):161-168. doi: 10.3121/cmr.2021.1654. Clin Med Res. 2021. PMID: 34933948 Free PMC article.
-
SARS-CoV-2 Testing, Positivity Rates, and Healthcare Outcomes in a Cohort of 22,481 Breast Cancer Survivors.JCO Clin Cancer Inform. 2021 Feb;5:168-175. doi: 10.1200/CCI.20.00158. JCO Clin Cancer Inform. 2021. PMID: 33539175
Cited by
-
Clinical and epidemiological characteristics of SARS-CoV-2 Infection in Los Angeles County youth during the first year of the pandemic.Int J Infect Dis. 2022 Sep;122:514-520. doi: 10.1016/j.ijid.2022.06.040. Epub 2022 Jul 6. Int J Infect Dis. 2022. PMID: 35803467 Free PMC article.
-
Epidemiology and SARS-CoV-2 Infection Patterns among Youth Followed at a Large Los Angeles Health Network during 2020-2022: Clinical Presentation, Prevalent Strains, and Correlates of Disease Severity.Vaccines (Basel). 2023 May 25;11(6):1024. doi: 10.3390/vaccines11061024. Vaccines (Basel). 2023. PMID: 37376413 Free PMC article.
-
Keeping university open did not increase the risk of SARS-CoV-2 acquisition: A test negative case-control study among students.PLoS One. 2024 Mar 27;19(3):e0301215. doi: 10.1371/journal.pone.0301215. eCollection 2024. PLoS One. 2024. PMID: 38536834 Free PMC article.
References
Grants and funding
LinkOut - more resources
Full Text Sources
Miscellaneous