. 2021 Nov 19:9:760309.
doi: 10.3389/fbioe.2021.760309. eCollection 2021.

A Pulmonary Vascular Model From Endothelialized Whole Organ Scaffolds

Affiliations

A Pulmonary Vascular Model From Endothelialized Whole Organ Scaffolds

Yifan Yuan et al. Front Bioeng Biotechnol. .

Abstract

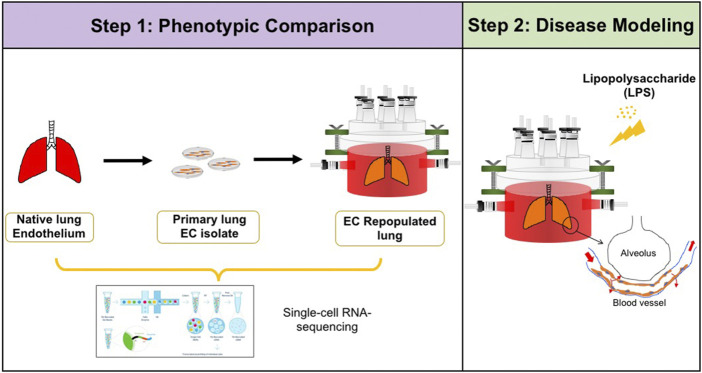
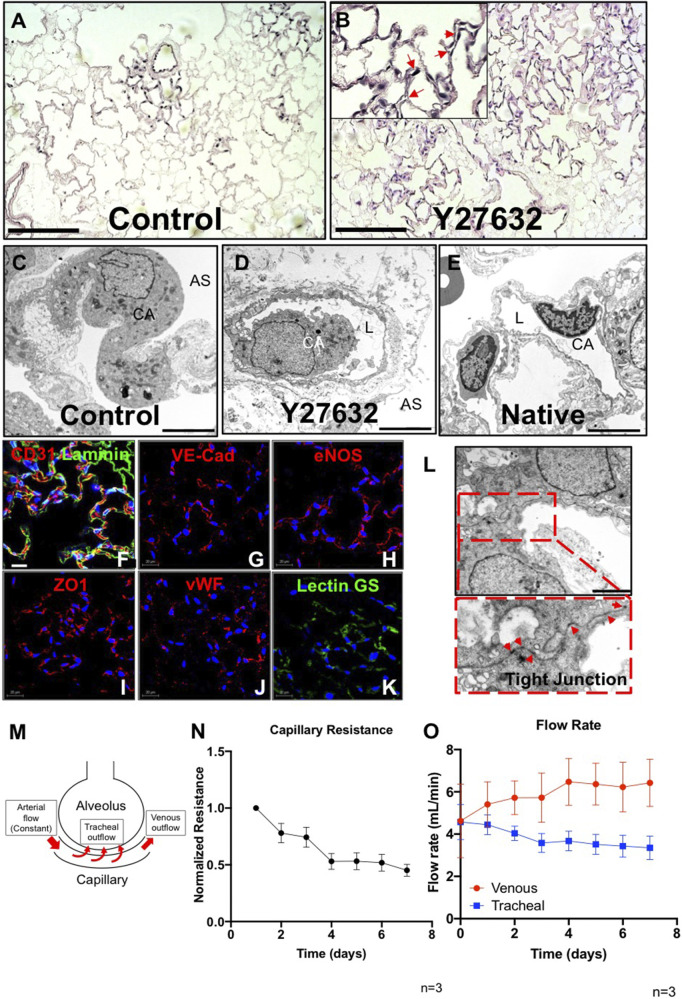
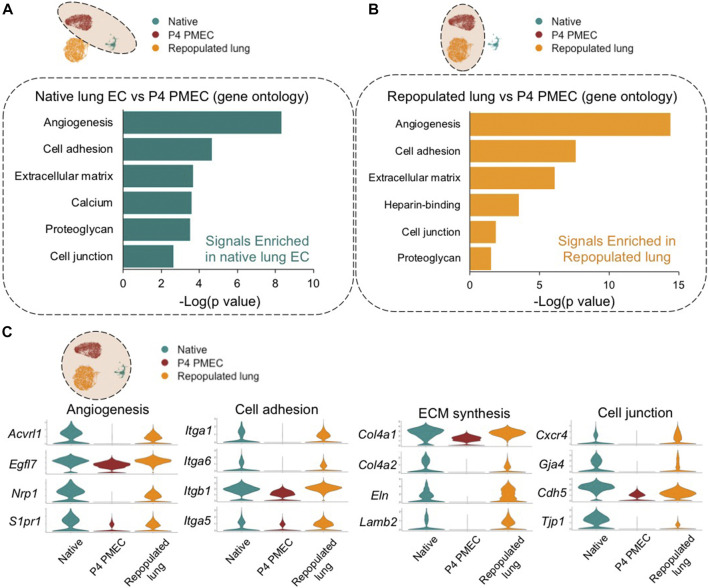
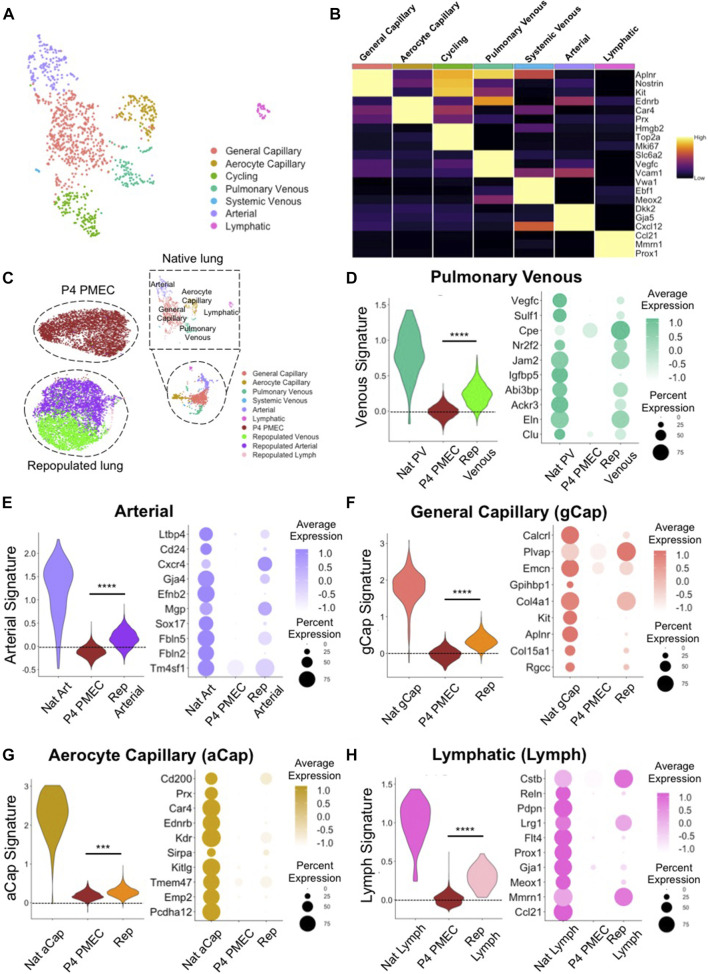
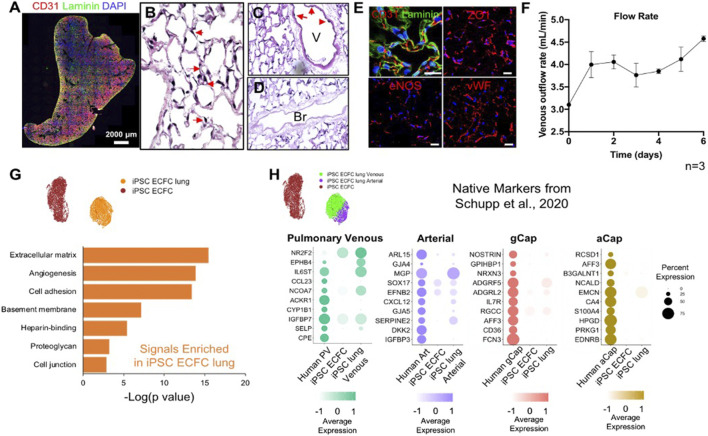
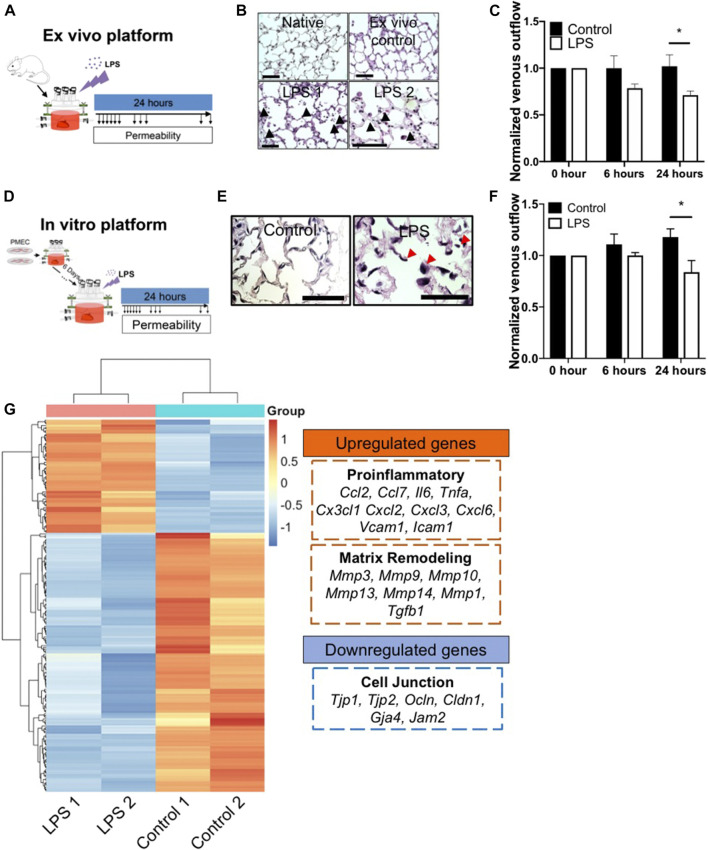
The development of an in vitro system for the study of lung vascular disease is critical to understanding human pathologies. Conventional culture systems fail to fully recapitulate native microenvironmental conditions and are typically limited in their ability to represent human pathophysiology for the study of disease and drug mechanisms. Whole organ decellularization provides a means to developing a construct that recapitulates structural, mechanical, and biological features of a complete vascular structure. Here, we developed a culture protocol to improve endothelial cell coverage in whole lung scaffolds and used single-cell RNA-sequencing analysis to explore the impact of decellularized whole lung scaffolds on endothelial phenotypes and functions in a biomimetic bioreactor system. Intriguingly, we found that the phenotype and functional signals of primary pulmonary microvascular revert back-at least partially-toward native lung endothelium. Additionally, human induced pluripotent stem cell-derived endothelium cultured in decellularized lung systems start to gain various native human endothelial phenotypes. Vascular barrier function was partially restored, while small capillaries remained patent in endothelial cell-repopulated lungs. To evaluate the ability of the engineered endothelium to modulate permeability in response to exogenous stimuli, lipopolysaccharide (LPS) was introduced into repopulated lungs to simulate acute lung injury. After LPS treatment, proinflammatory signals were significantly increased and the vascular barrier was impaired. Taken together, these results demonstrate a novel platform that recapitulates some pulmonary microvascular functions and phenotypes at a whole organ level. This development may help pave the way for using the whole organ engineering approach to model vascular diseases.

Keywords: endothelium; in vitro disease modeling; pulmonary vasculature; single-cell RNA-sequencing; whole lung tissue engineering.


Conflict of interest statement

LEN is a founder and shareholder in Humacyte, Inc. The remaining authors declare that the research was conducted in the Q14 absence of any commercial or financial relationships that could be construed as a potential conflict of interest.

Figures

FIGURE 1
FIGURE 1
Schematic of experimental design. Step 1: single-cell RNA-sequencing analysis was performed to compare the phenotypic and functional signals among native pulmonary endothelium, primary pulmonary endothelium cultured on tissue culture plastic, and in whole lung scaffolds. Step 2: Lipopolysaccharide (LPS) was introduced into endothelialized whole lung scaffolds to simulate inflammation.
FIGURE 2
FIGURE 2
Characterization of PMEC-repopulated lungs. (A,B) H/E image of a representative section in control (A) and Y27632-treated repopulated lungs (B). Scale bars 150 μm, arrows point to reconstituted capillary lumens. (C,D,E) TEM images of control, Y27632-treated repopulated lungs, and native lungs, respectively. Scale bars 5 μm, CA: Capillary; AS: Alveolar Space; L: Lumen. (F–K) Immunostaining for CD31, VE-Cad, eNOS, ZO1, vWF, and lectin GS in repopulated lungs, scale bar 20 μm. (L) Representative TEM image of tight junctions in repopulated lungs. Arrowheads indicate tight junctions, scale bar 2 μm. (M) Schematic description of the flow paths in decellularized lung vasculature. (N,O) Non-invasive measurements were performed daily to assess the mechanical characteristics in repopulated lungs. (N) Capillary resistances to fluid flow within the vascular bed, versus time. (O) Flow rates: venous (red), and tracheal (blue) outflows versus time. “n” indicates experimental replicates. There were three independent experiments performed for each condition.
FIGURE 3
FIGURE 3
Global comparison amongst Native, P4 PMEC, and Repopulated lung. (A,B) Gene ontology analysis shows the top upregulated signals based on the top DEGs of comparisons between Native endothelium and P4 PMEC (A), and between Repopulated lung and P4 PMEC (B). (C) VlnPlots of representative genes of angiogenesis, cell adhesion, ECM synthesis, and cell junction in the merged dataset of Native, P4 PMEC, and Repopulated lung samples.
FIGURE 4
FIGURE 4
scRNAseq evaluation of native and engineered rat pulmonary endothelium. (A) Uniform Manifold Approximation and Projection (UMAP) of the native pulmonary endothelial clusters. (B) Heatmap of top 3 DEGs for each cluster. (C) UMAPplots of merged object of native pulmonary endothelial clusters, pre-seeded PMECs, and repopulated lungs. (D–H) Dotplots and Module scores for (D) pulmonary venous, (E) arterial, (F) gCap, (G) aCap, and (H) lymph endothelium amongst native and engineered endothelium. Dot plots show the comparison for top 10 select markers of each native lung EC subtype. Samples were merged and re-scaled. Module scores were calculated based on the top 20 DEGs of each native lung EC subtypes in each engineered EC dataset at single cell level. Violin plots represent the distribution of module score for each EC subtype among native endothelium, P4 PMEC, and repopulated lung datasets. Scores >0 indicate enriched expression, compared to random control gene sets. ***, and **** indicate p < 0.001, and p < 0.0001, respectively.
FIGURE 5
FIGURE 5
Human iPSC-ECFCs start to gain native EC phenotype in repopulated lungs. (A) Immunostaining of CD31 and Laminin in iPSC-ECFC-repopulated lungs. Scale bar 2,000 μm. (B–D) H/E image of a representative section iPSC-ECFC repopulated lungs. Arrows in (B) point to reconstituted capillary lumens; arrows in (C) point to endothelial cells in the vasculature but not in bronchia. V: Blood Vessel; Br: Bronchi (E) Immunostaining for CD31, laminin, ZO1, eNOS, and vWF in repopulated lungs, scale bar 20 μm. (F) Venous outflows versus time, n = 3. (G) Gene ontology analysis of the top DEGs (p < 0.05) enriched in iPSC-ECFC lungs as compared to pre-seeded iPSC-ECFCs. (H) Dot plots show the comparison for top 10 select native markers of human pulmonary venous, arterial, gCap, and aCap amongst native human lung endothelium, pre-seeded iPSC-ECFCs, and iPSC-ECFC-repopulated lungs. Samples were merged and re-scaled.
FIGURE 6
FIGURE 6
The ex vivo and in vitro platform to model LPS-induced inflammation. (A) Schematic of workflow for the ex vivo platform. (B) Representative H/E images of lung tissues from native, ex vivo control, and ex vivo LPS samples. Arrows indicate cell death, matrix breakdown, and interstitial puffing. Scale bar indicate 75 μm. (C) Venous outflows in the ex vivo platform with or without LPS treatment, n = 3. (D) Schematic of workflow for the in vitro platform. (E) Representative H/E images of lung tissues from control and LPS-treated repopulated lungs. Arrows indicate cell detachment and occlusion in the pulmonary vasculature. Scale bar indicate 75 μm. (F) Venous outflows in the repopulated lung control, and repopulated lung LPS conditions, versus time, n = 3. (G) Heatmap of top differentially (adjusted p < 0.05 and log2foldchange >3 or <−3) expressed genes between control and LPS-treated repopulated lungs, normalized across each gene to show up-regulation (red) and down-regulation (blue) as compared to the other group. The representative upregulated and downregulated genes after LPS treatment as compared to control without LPS were listed. * indicate p < 0.05. There were 3–4 replicates performed in each sample.

References

    1. Ackermann M., Verleden S. E., Kuehnel M., Haverich A., Welte T., Laenger F., et al. (2020). Pulmonary Vascular Endothelialitis, Thrombosis, and Angiogenesis in Covid-19 383 (20), 120–128. 10.1056/NEJMoa2015432 - DOI - PMC - PubMed
    1. Alphonse R. S., Vadivel A., Zhong S., McConaghy S., Ohls R., Yoder M. C., et al. (2016). Erratum: Corrigendum: The Isolation and Culture of Endothelial colony-forming Cells from Human and Rat Lungs. Nat. Protoc. 11, 192. 10.1038/nprot0116-192c - DOI - PubMed
    1. Alphonse R. S., Vadivel A., Zhong S., McConaghy S., Ohls R., Yoder M. C., et al. (2015). The Isolation and Culture of Endothelial colony-forming Cells from Human and Rat Lungs. Nat. Protoc. 10, 1697–1708. 10.1038/nprot.2015.107 - DOI - PubMed
    1. Amano M., Nakayama M., Kaibuchi K. (2010). Rho-kinase/ROCK: A Key Regulator of the Cytoskeleton and Cell Polarity. Cytoskeleton 67, 545–554. 10.1002/cm.20472 - DOI - PMC - PubMed
    1. Baeyens N., Bandyopadhyay C., Coon B. G., Yun S., Schwartz M. A. (2016). Endothelial Fluid Shear Stress Sensing in Vascular Health and Disease. J. Clin. Invest. 126, 821–828. 10.1172/jci83083 - DOI - PMC - PubMed