. 2021 Nov 18:9:751590.
doi: 10.3389/fcell.2021.751590. eCollection 2021.

Strong Expansion of Human Regulatory T Cells for Adoptive Cell Therapy Results in Epigenetic Changes Which May Impact Their Survival and Function

Affiliations

Strong Expansion of Human Regulatory T Cells for Adoptive Cell Therapy Results in Epigenetic Changes Which May Impact Their Survival and Function

Kristy Ou et al. Front Cell Dev Biol. .

Abstract

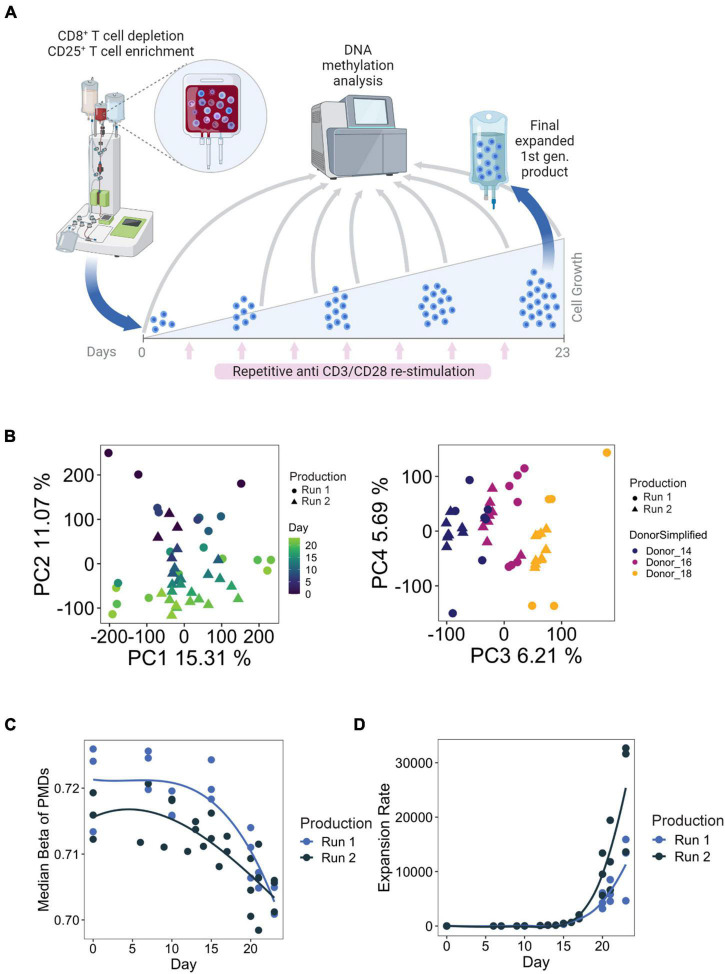
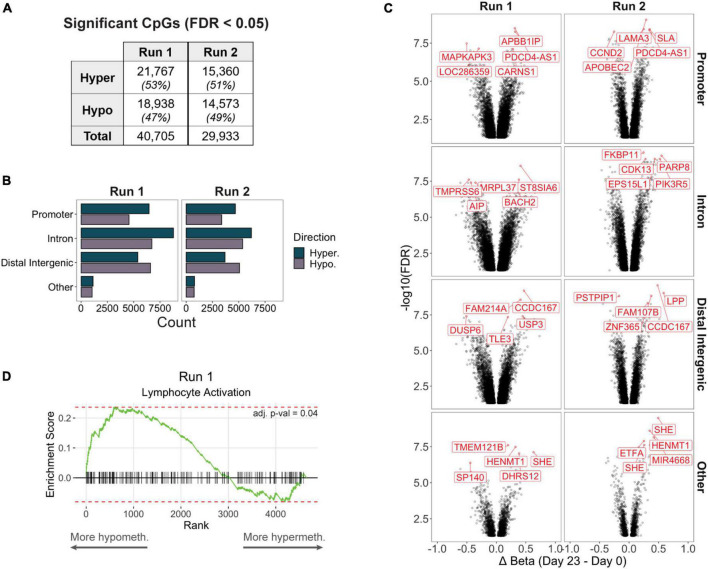
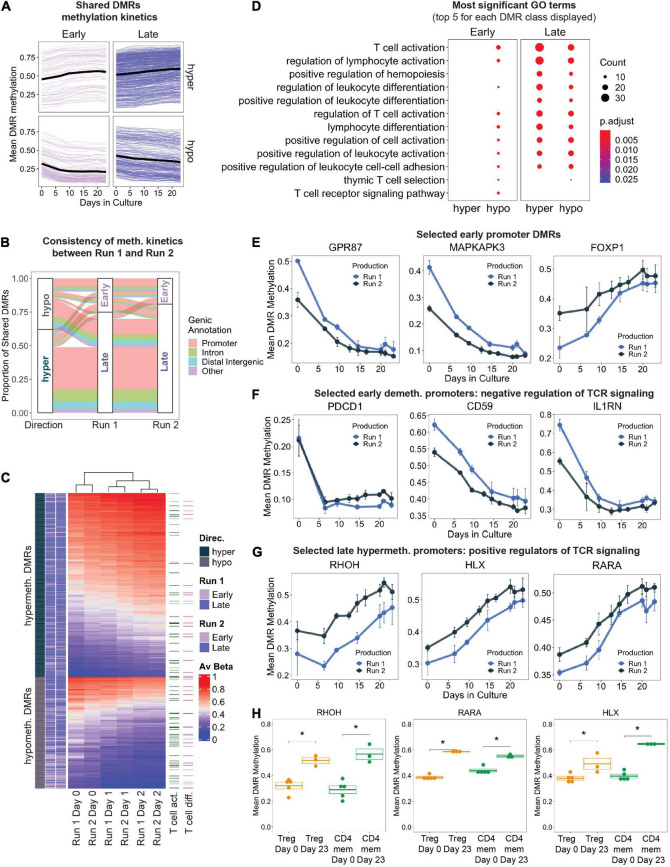
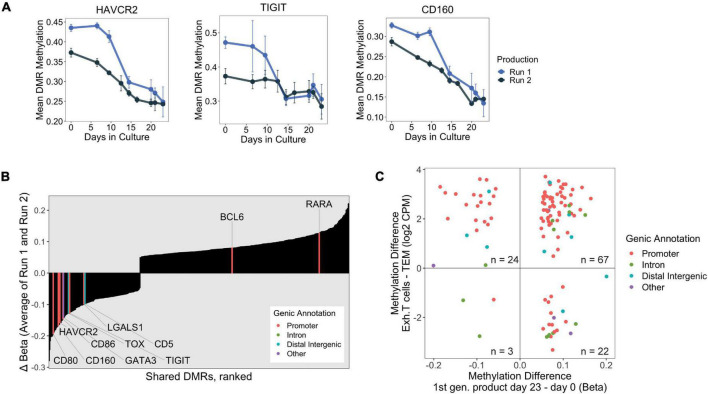
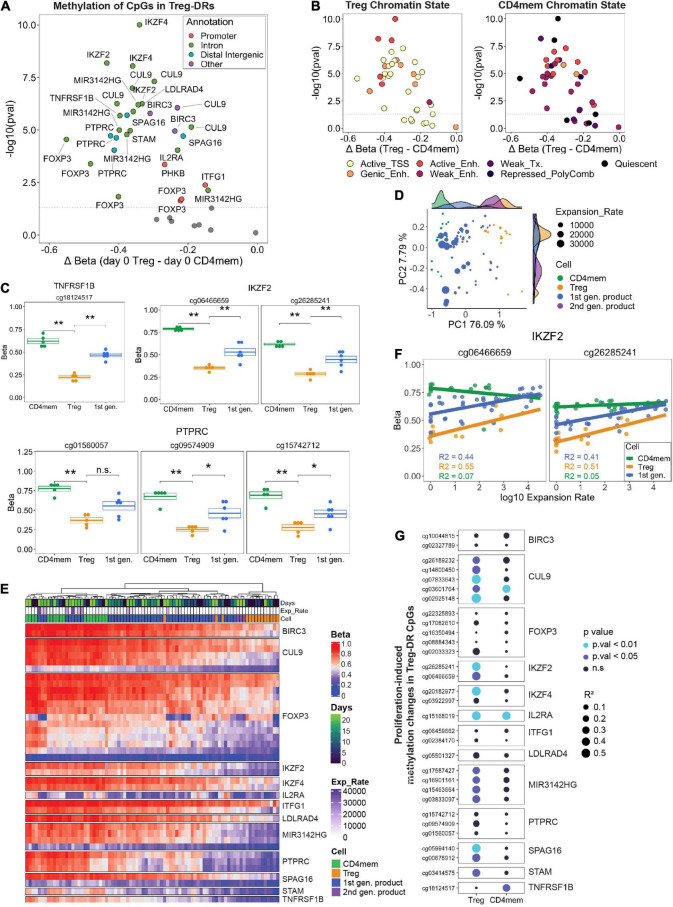
Adoptive transfer of regulatory T cells (Treg) is a promising new therapeutic option to treat detrimental inflammatory conditions after transplantation and during autoimmune disease. To reach sufficient cell yield for treatment, ex vivo isolated autologous or allogenic Tregs need to be expanded extensively in vitro during manufacturing of the Treg product. However, repetitive cycles of restimulation and prolonged culture have been shown to impact T cell phenotypes, functionality and fitness. It is therefore critical to scrutinize the molecular changes which occur during T cell product generation, and reexamine current manufacturing practices. We performed genome-wide DNA methylation profiling of cells throughout the manufacturing process of a polyclonal Treg product that has proven safety and hints of therapeutic efficacy in kidney transplant patients. We found progressive DNA methylation changes over the duration of culture, which were donor-independent and reproducible between manufacturing runs. Differentially methylated regions (DMRs) in the final products were significantly enriched at promoters and enhancers of genes implicated in T cell activation. Additionally, significant hypomethylation did also occur in promoters of genes implicated in functional exhaustion in conventional T cells, some of which, however, have been reported to strengthen immunosuppressive effector function in Tregs. At the same time, a set of reported Treg-specific demethylated regions increased methylation levels with culture, indicating a possible destabilization of Treg identity during manufacturing, which was independent of the purity of the starting material. Together, our results indicate that the repetitive TCR-mediated stimulation lead to epigenetic changes that might impact functionality of Treg products in multiple ways, by possibly shifting to an effector Treg phenotype with enhanced functional activity or by risking destabilization of Treg identity and impaired TCR activation. Our analyses also illustrate the value of epigenetic profiling for the evaluation of T cell product manufacturing pipelines, which might open new avenues for the improvement of current adoptive Treg therapies with relevance for conventional effector T cell products.

Keywords: DNA methylation; adoptive cell therapy; advanced therapy medicinal products; biomarker; good manufacturing practice; regulatory T cells.


Conflict of interest statement

The authors declare that the research was conducted in the absence of any commercial or financial relationships that could be construed as a potential conflict of interest.

Figures

FIGURE 1
FIGURE 1
(A) Example manufacturing run for first-generation Treg products. Briefly, Tregs were enriched through CD8+ depletion followed by CD25+ enrichment using the CliniMACS® system from whole blood. Tregs are cultured over the course of 23 days, with 8 total stimulations with anti-CD3/CD28 microbeads. Time points used for DNA methylation analysis are indicated with the gray arrows. Figure created with BioRender.com. (B) PCA analysis of samples taken from all available time points from both manufacturing runs. (C,D) Median methylation values of partially methylated domains (PMDs) (left) and cumulated expansion rate (right) during Treg product generation.
FIGURE 2
FIGURE 2
(A) Significantly differentially methylated CpGs (differentially methylated positions, DMPs) between day 0 and day 23 products in each production run. (B) Counts of hyper- or hypomethylated DMPs mapping to the promoter, intron, distal intergenic, or other (5′ or 3′ UTRs, exons, or immediate downstream) region of a gene. (C) Volcano plots of significant DMPs (FDR < 0.05) stratified by genic annotation. The top 5 most significant DMPs (stratified by genic annotation) are highlighted. (D) In Run 1, genes that contained at least 1 promoter DMP but did not contain any differentially methylated regions (DMRs, including at least 3 CpGs) were significantly enriched for the Lymphocyte Activation pathway (adj. p-val < 0.05).
FIGURE 3
FIGURE 3
(A) Change in mean DMR methylation of shared DMRs over the 23 days of in vitro expansion. Early DMRs were defined as being significantly differentially methylated in day 10 – day 0 (and remained significant in day 23 – day 0), and Late DMRs were only significantly differentially methylated at day 23 – day 0. Each line displays one DMR, bold black line displays the mean. (B) Display of all shared DMRs according to their directionality of methylation change (hyper/hypo) and to their Early/Late classification (as in A) in production Run1 and 2. Color code indicates genic annotation of the DMR. (C) Unsupervised hierarchical clustering of shared DMRs in both production runs, with DMRs mapping to genes implicated in T cell activation and T cell differentiation (GO terms 0042110 and 0030217) highlighted. (D) Gene ontology enrichment analysis of shared DMRs that were consistently “Early” or “Late” between both production runs, stratified by directionality. The top 5 GO terms (ranked by adjusted p-value) for each DMR class are represented, many of which overlap. Size of dots indicates number of genes associated with GO term, and color indicates adjusted p-value. (E–G) Level of DNA methylation on selected DMRs in known T cell genes. (H) DNA methylation at the promoters of RHOH, HLX, and RARA in FACS-sorted Tregs and memory CD4+ T cells (CD4mem) before (Day 0) and after frequent CD3/CD28 stimulation (Day 23). denotes p.val < 0.05 (T test).
FIGURE 4
FIGURE 4
(A) DNA methylation changes over 23 days at the promoters of select exhaustion-associated loci. (B) Consistently “Late” shared DMRs were ranked by final change in methylation (Day 23 – Day 0, averaged over both production runs). Genes implicated in exhaustion, taken from publicly available datasets, are highlighted with associated genic annotation. Notably, many of the exhaustion associated genes are among the strongest hypomethylated DMRs. (C) Scatter plot displaying shared DMRs which overlapped with ExhDMRs identified from WGBS comparing exhausted CD8 T cells vs. CD8 effector memory T cells. The x-axis depicts methylation difference between day 23 and day 0 products (average of both runs), and y-axis depicts methylation difference between functionally exhausted CD8 T cells (Exh. T cells) and CD8 effector memory T cells (TEM).
FIGURE 5
FIGURE 5
(A) FACS-sorted Tregs and CD4 memory T cells (Day 0) were analyzed for CpG methylation at Treg specific demethylated regions (Treg-DRs). Significantly differentially methylated CpGs (p. val < 0.05, Student’s t-test) were color-coded by genic annotation. (B) CpGs in Treg-DRs plotted with the same axes as A, but color-coded by chromatin state annotation (TSS = transcription start site; Enh. = enhancer; Tx = transcription). (C) Methylation levels (Beta) of selected Treg-DRs in Treg, CD4mem and Treg products on day 0. *denotes p.val < 0.05, **p.val < 0.01, ns = not significant (T test). (D) PCA analysis of day 0 and day 23 1st generation products, FACS-sorted Tregs and CD4mem as well as day 23 2nd generation products. Histograms at the top and right display representation on PC1 and PC2, respectively, of the sample distribution for each experimental group. (E) Unsupervised hierarchical clustering of all samples based on methylation levels of Treg-DRs CpGs. (F) DNA methylation change of the IKZF2 Treg-DR in CD4mem, Tregs and 1st gen Treg product in relation to the expansion rate. R2 values display the degree of correlation (see G). (G) Results of linear regression analysis of all differentially methylated Treg-DRs on day 0 (see A) calculating the degree of correlation between gain of methylation and log10 expansion rate. Higher R2 value (indicated by size of the dot) indicates greater correlation. P-values are indicated by color.

References

    1. Abdelsamed H. A., Moustaki A., Fan Y., Dogra P., Ghoneim H. E., Zebley C. C., et al. (2017). Human memory Cd8 T cell effector potential is epigenetically preserved during in vivo homeostasis. J. Exp. Med. 214 1593–1606. 10.1084/jem.20161760 - DOI - PMC - PubMed
    1. Abdelsamed H. A., Zebley C. C., Nguyen H., Rutishauser R. L., Fan Y., Ghoneim H. E., et al. (2020). Beta cell-specific CD8(+) T cells maintain stem cell memory-associated epigenetic programs during type 1 diabetes. Nat. Immunol. 21 578–587. 10.1038/s41590-020-0633-5 - DOI - PMC - PubMed
    1. Allen J. D., Harris A. W., Bath M. L., Strasser A., Scollay R., Adams J. M. (1995). Perturbed development of T and B cells in mice expressing an Hlx homeobox transgene. J. Immunol. 154 1531–1542. - PubMed
    1. Alzhrani A., Bottomley M., Wood K., Hester J., Issa F. (2020). Identification, selection, and expansion of non-gene modified alloantigen-reactive Tregs for clinical therapeutic use. Cell. Immunol. 357:104214. 10.1016/j.cellimm.2020.104214 - DOI - PMC - PubMed
    1. Anastasiadi D., Esteve-Codina A., Piferrer F. (2018). Consistent inverse correlation between DNA methylation of the first intron and gene expression across tissues and species. Epigenetics Chromatin 11:37. 10.1186/s13072-018-0205-1 - DOI - PMC - PubMed

LinkOut - more resources