

Identification of Galectin-3 as Potential Biomarkers for Renal Fibrosis by RNA-Sequencing and Clinicopathologic Findings of Kidney Biopsy
- PMID: 34869439
- PMCID: PMC8633540
- DOI: 10.3389/fmed.2021.748225
Identification of Galectin-3 as Potential Biomarkers for Renal Fibrosis by RNA-Sequencing and Clinicopathologic Findings of Kidney Biopsy
Abstract
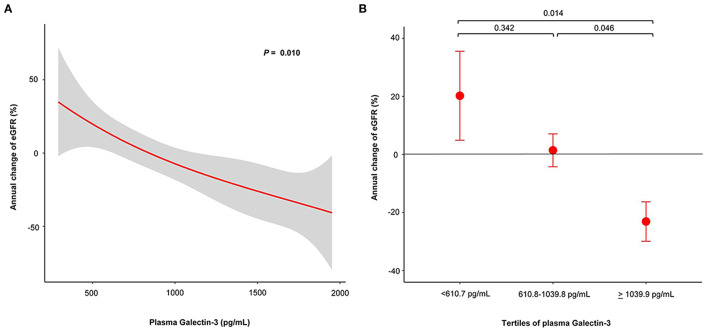
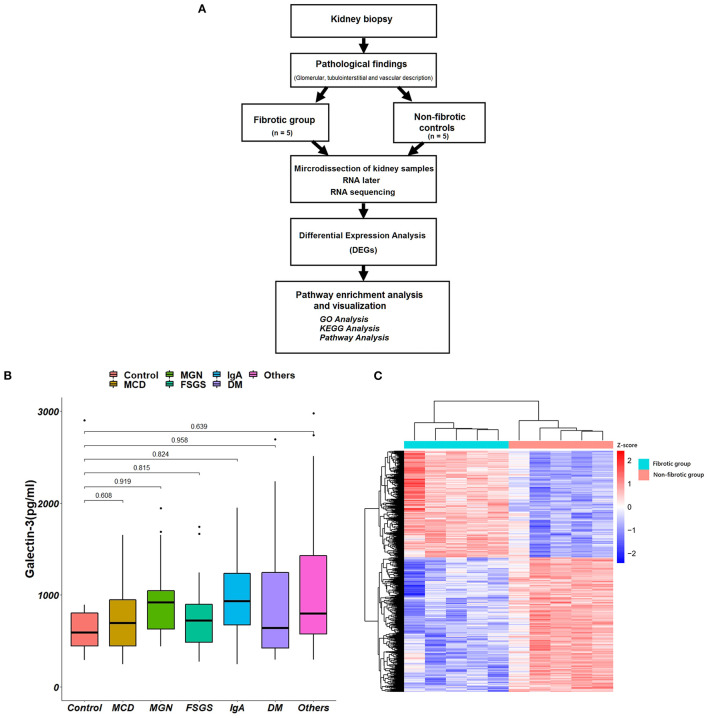
Background: Galectin-3 (Gal-3) is a multifunctional glycan-binding protein shown to be linked to chronic inflammation and fibrogenesis. Plasma Gal-3 is associated with proteinuria and renal dysfunction, but its role has never been confirmed with kidney biopsy results. In our study, we aimed to explore the expression of Gal-3 in biopsy-proven patients, and we tested the hypothesis that chronic kidney disease (CKD) leads to upregulation of plasma Gal-3 expression in corresponding biopsy findings and RNA sequencing analysis. Method: In 249 patients (male/female: 155/94, age: 57.2 ± 16.3 years) who underwent kidney biopsy, plasma levels of Gal-3 were measured to estimate the association of renal fibrosis. Relationships between plasma Gal-3 levels, estimated glomerular filtration rate (eGFR) and renal histology findings were also assessed. We further examined the gene expression of Gal-3 in RNA-sequencing analysis in biopsy-proven patients. Results: Compared to patients without CKD, CKD patients had higher levels of plasma Gal-3 (1,016.3 ± 628.1 pg/mL vs. 811.6 ± 369.6 pg/ml; P = 0.010). Plasma Gal-3 was inversely correlated with eGFR (P = 0.005) but not with proteinuria. Higher Gal-3 levels were associated with interstitial fibrosis, tubular atrophy and vascular intimal fibrosis. RNA-sequencing analysis showed the upregulation of Gal-3 in fibrotic kidney biopsy samples, and the differentially expressed genes were mainly enhanced in immune cell activation and the regulation of cell-cell adhesion. Conclusions: Plasma Gal-3 levels are inverse correlated with eGFR but positively correlated with renal fibrosis, which may be involved in the immune response and associated pathways. These findings support the role of Gal-3 as a predictive marker of renal fibrosis.
Keywords: RNA-sequencing analysis; chronic kidney disease; galectin-3; interstitial fibrosis; kidney biopsy; tubular atrophy.
Copyright © 2021 Ou, Tsai, Chen, Li, Tseng, Lee, Chang, Lin, Yang and Tarng.
Conflict of interest statement
The authors declare that the research was conducted in the absence of any commercial or financial relationships that could be construed as a potential conflict of interest.
Figures


Similar articles
-
Urinary Galectin-3 as a Novel Biomarker for the Prediction of Renal Fibrosis and Kidney Disease Progression.Biomedicines. 2022 Mar 2;10(3):585. doi: 10.3390/biomedicines10030585. Biomedicines. 2022. PMID: 35327386 Free PMC article.
-
Plasma Galectin-9 Is a Useful Biomarker for Predicting Renal Function in Patients Undergoing Native Kidney Biopsy.Arch Pathol Lab Med. 2023 Feb 1;147(2):167-176. doi: 10.5858/arpa.2021-0466-OA. Arch Pathol Lab Med. 2023. PMID: 35687787
-
Plasma galectin-3 is associated with decreased glomerular filtration rate in chronic HIV.HIV Res Clin Pract. 2023 Sep 20;24(1):2261753. Epub 2023 Oct 2. HIV Res Clin Pract. 2023. PMID: 37783570 Free PMC article.
-
Role of galectin-3 in autoimmune and non-autoimmune nephropathies.Autoimmun Rev. 2017 Jan;16(1):34-47. doi: 10.1016/j.autrev.2016.09.023. Epub 2016 Sep 23. Autoimmun Rev. 2017. PMID: 27666815 Review.
-
[Identification of Biomarkers for Tubular Injury and Interstitial Fibrosis in Chronic Kidney Disease].Yakugaku Zasshi. 2017;137(11):1355-1360. doi: 10.1248/yakushi.17-00150. Yakugaku Zasshi. 2017. PMID: 29093371 Review. Japanese.
Cited by
-
Circulating galectin-3 level association with cardiovascular risk factors during peritoneal dialysis.Clin Exp Nephrol. 2024 Sep;28(9):925-931. doi: 10.1007/s10157-024-02498-3. Epub 2024 Apr 20. Clin Exp Nephrol. 2024. PMID: 38643287 Free PMC article.
-
Construction of a neural network diagnostic model for renal fibrosis and investigation of immune infiltration characteristics.Front Immunol. 2023 Jun 9;14:1183088. doi: 10.3389/fimmu.2023.1183088. eCollection 2023. Front Immunol. 2023. PMID: 37359552 Free PMC article.
-
Melatonin ameliorates bleomycin-induced pulmonary fibrosis via activating NRF2 and inhibiting galectin-3 expression.Acta Pharmacol Sin. 2023 May;44(5):1029-1037. doi: 10.1038/s41401-022-01018-x. Epub 2022 Nov 4. Acta Pharmacol Sin. 2023. PMID: 36333557 Free PMC article.
-
Urinary Galectin-3 as a Novel Biomarker for the Prediction of Renal Fibrosis and Kidney Disease Progression.Biomedicines. 2022 Mar 2;10(3):585. doi: 10.3390/biomedicines10030585. Biomedicines. 2022. PMID: 35327386 Free PMC article.
-
The potential roles of galectin-3 in AKI and CKD.Front Physiol. 2023 Feb 23;14:1090724. doi: 10.3389/fphys.2023.1090724. eCollection 2023. Front Physiol. 2023. PMID: 36909244 Free PMC article. Review.
References
-
- Bansal N, Katz R, Robinson-Cohen C, Odden MC, Dalrymple L, Shlipak MG, et al. . Absolute rates of heart failure, coronary heart disease, and stroke in chronic kidney disease: an analysis of 3 community-based cohort studies. JAMA Cardiol. (2017) 2:314–8. 10.1001/jamacardio.2016.4652 - DOI - PMC - PubMed
LinkOut - more resources
Full Text Sources
Research Materials
Miscellaneous