. 2021 Oct 27;5(11):nzab129.
doi: 10.1093/cdn/nzab129. eCollection 2021 Nov.

Immunodeficiency Accelerates Vitamin A Deficiency

Affiliations

Immunodeficiency Accelerates Vitamin A Deficiency

Luigi M De Luca et al. Curr Dev Nutr. .

Abstract

Background: Vitamin A deficiency increases susceptibility to infection caused by impaired immune function.

Objectives: We investigated whether immunodeficiency could facilitate the development of vitamin A deficiency.

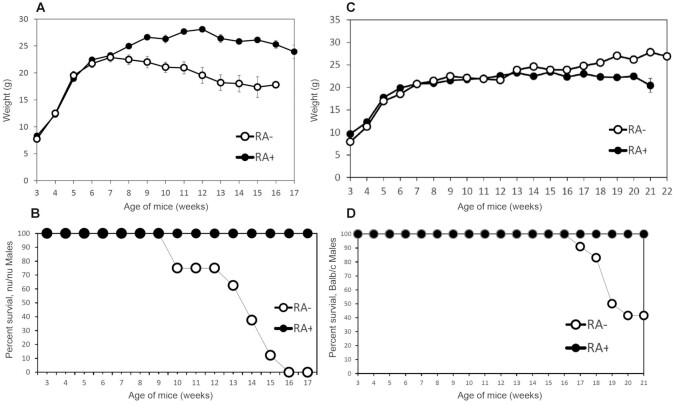
Methods: Vitamin A deficiency was followed in 2 mouse models of immunodeficiency: the athymic nude mouse (nu/nu) and the humoral immunodeficient SENCAR (SENsitive to CARcinogenesis) mouse. Vitamin A deficiency was also monitored in outbred Balb/c and in NIH mice. The monitoring of vitamin A deficiency was done after feeding the mice and their mothers a semisynthetic, vitamin A-deficient diet from birth of the experimental mice. These mice were weaned onto the same deficient diet at 3-4 wk of age, while control groups were fed the same diet containing 3 μg retinoic acid per gram of diet.

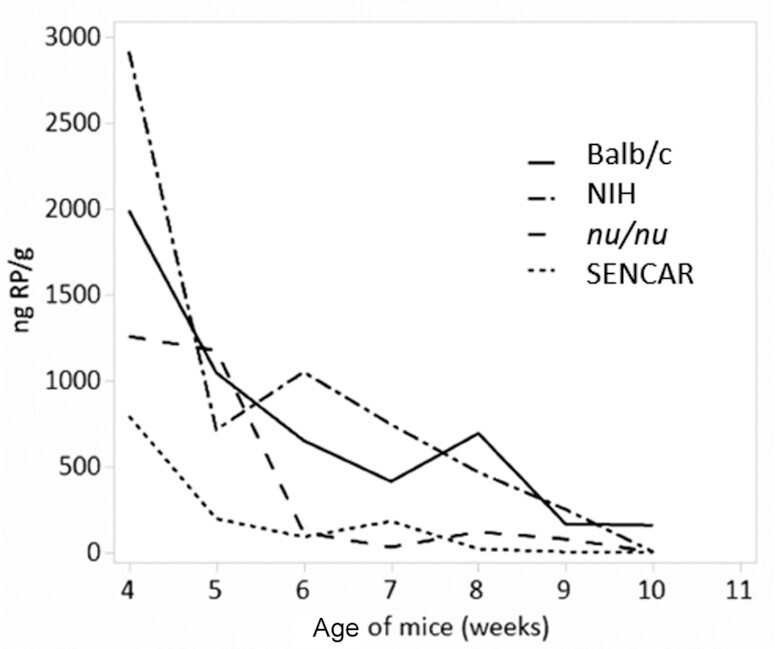
Results: The immunodeficient nu/nu and SENCAR mice developed vitamin A deficiency earlier than either the heterozygous nu/+ controls or the Balb/c and NIH strains. In female mice, symptoms included depletion of liver retinol and retinyl palmitate, squamous metaplasia of the uterus, and death. Male mice lost weight more frequently and sooner than female mice, in which mortality generally occurred in the absence of loss of body weight. Pairwise comparisons using Tukey's honest significant difference test of the nu/nu and SENCAR mice versus the Balb/c and NIH mice showed a faster loss of retinol and retinyl palmitate in all pairs (P ≤ 0.0001) except for retinol when comparing nu/nu and NIH strains (P = 0.3383).

Conclusions: Our findings are consistent with an increased usage of liver retinol and retinyl palmitate in the immunocompromised nu/nu and in the immunodeficient SENCAR mice and suggest that compensatory mechanisms dependent on vitamin A utilization are called upon to rescue immunodeficiency both in the T-cell-deficient phenotype of the nu/nu mice and in the humoral immunodeficient SENCAR mice.

Keywords: SENCAR (SENsitive to CARcinogenesis) mice; athymic mice; immunodeficiency; retinol; retinyl palmitate; vitamin A deficiency.


Figures

FIGURE 1
FIGURE 1
Body weights of the females of different mouse strains maintained on an RA− diet. Body weights were measured in groups of 4 mice housed in each cage between week 3 (weaning time) and week 17 of age. Measurements for the nu/nu mice were stopped at week 13 because of mortality.
FIGURE 2
FIGURE 2
Body weights and survival of the females of nu/nu mice maintained on an RA+ or on an RA− diet. (A) Body weights of nu/nu female mice fed the RA+ (9 mice at week 3) and RA– (10 mice at week 3) diets. Comparisons were made using a 2-tailed t test for 2 samples with unequal variances. Error bars represent SEs. At week 18, the weights of the RA+ mice were significantly (P < 0.01) greater than those of the RA− group. (B) Comparison of % survival of nu/nu female mice fed the RA+ (9 mice at week 3) and RA– (10 mice at week 3) diets.
FIGURE 3
FIGURE 3
Body weights and survival of the females of nu/nu and nu/+ mice maintained on an RA– diet. (A) Survival comparison between nu/nu and nu/+ female littermates. The constant rate of decline (4 mice per week in both groups) represents utilization of these mice for retinoid measurement (Figures 6–9) and for immunohistochemistry (Figure 11 and Table 1). (B) Comparison of body weights between nu/nu (31 mice at week 3 of age) and nu+ (25 mice at week 3 of age) female mice maintained on an RA– diet. Comparisons were made using a 2-tailed t test for 2 samples with unequal variances. Error bars represent SEs. The weights of the nu/nu mice could only be measured up to week 13 because of mortality. (C) Survival curves for nu/nu and nu+ female mice maintained on a vitamin A–deficient diet.
FIGURE 4
FIGURE 4
Body weights and survival of Balb/c female mice maintained on an RA+ or on an RA− diet. (A) Comparison of body weights in Balb/c female mice maintained on an RA+ (6 mice) or RA– diet (6 mice at week 3 of age). In weeks 5 and 6, the weight of RA− mice is significantly greater than RA+ (P < 0.05). At week 20, RA+ mice were significantly heavier (P < 0.01) than the RA– mice. (B) Percentage survival in Balb/c females mice kept on an RA+ or RA– diet.
FIGURE 5
FIGURE 5
Body weights and survival of the males of different mouse strains maintained on an RA+ or on an RA– diet. (A) Body weights of nu/nu male mice maintained on an RA– diet (8 mice at week 3) or on an RA+ diet (9 mice). Comparisons were made using a 2-tailed t test for 2 samples with unequal variances. At week 8, the weight of the RA+ group is statistically significantly greater than that of the RA– group (P < 0.05) and at weeks 9–14 at a highly significant level (P < 0.01). Comparisons were made using a 2-tailed t test for 2 samples with unequal variances. Error bars represent SEs. (B) Comparison of percentage survival of nu/nu male mice (shown in Figure 2A) fed the RA+ and RA– diet. (C) Body weights of Balb/c male mice maintained either on an RA– (12 mice at week 3 of age) or on an RA+ (8 mice) diet. The weight of the RA+ group is statistically significantly greater (P < 0.01) than that of the RA– group from week 17 to 21. Comparisons were made using a 2-tailed t test for 2 samples with unequal variances. Error bars represent SEs. (D) Survival (%) of Balb/c male mice (shown in Figure 5C for body weight) maintained either on an RA− or RA+ diet.
FIGURE 6
FIGURE 6
HPLC analysis of liver retinol. Line plot showing the mean retinol concentration over age (in weeks) of 4 mouse strains starting at week 4.
FIGURE 7
FIGURE 7
Regression plot for retinol. Regression plot from the ANCOVA of the square root of nanograms Rol/gram versus age (in weeks) for 4 different mouse strains ages 4–11 wk.
FIGURE 8
FIGURE 8
HPLC analysis of liver RP. Line plot showing the mean RP concentration over age (in weeks) of 4 mouse strains starting at week 4.
FIGURE 9
FIGURE 9
Regression plot for RP. Regression plot from the ANCOVA of the square root of nanograms RP/gram versus age (in weeks) for 4 different mouse strains ages 4–10 wk.
FIGURE 10
FIGURE 10
Comparison in RP concentrations between nu/nu and nu/+ littermates. Mice in this experiment were weaned onto the vitamin A–deficient diet at week 4. Using the Wilcoxon rank-sum test, differences between homozygous and heterozygous mice were significant for week 8 (< 0.001), week 9 (= 0.013), and week 10 (= 0.021). The P value for week 11 was 0.06.
FIGURE 11
FIGURE 11
Monitoring of squamous metaplasia of the uterine epithelium by immunohistochemistry. Procedures were as described in the Methods section. (A, B) The heterozygous littermate nu/+ mice showed squamous metaplastic foci staining for keratin 5 at week 13 (original magnification is 80× in panel A and 630× in panel B). (B) The stratified-squamous morphology of the metaplastic focus. (C) The nude (nu/nu) mice began to show squamous metaplastic foci at week 10 (original magnification, 50×). (D) Complete replacement of the simple columnar epithelium of the uterine glands with a stratified squamous epithelium, which stains with keratin-5 antibody, is clearly visible (original magnification is 6.5×) in all mouse strains surviving at 15 wk on the vitamin A–deficient diet. RA-fed mice failed to show any staining (not shown).

References

    1. Vargas-Hernández A. Human signal transducer and activator of transcription 5b (STAT5b) mutation causes dysregulated human natural killer cell maturation and impaired lytic function. J Allergy Clin Immunol. 2020;145(1):345–57.e9. - PMC - PubMed
    1. Mace EM, Orange JS. Genetic causes of human NK cell deficiency and their effect on NK cell subsets. Front Immunol. 2016;7(545):1–8. - PMC - PubMed
    1. Berger M, Geng B, Cameron DW, Murphy LM, Schulman ES. Primary immune deficiency diseases as unrecognized causes of chronic respiratory disease. Respir Med. 2017;132:181–8. - PubMed
    1. Van der Veen TA, de Groot LES, Melgert BN. The different faces of the macrophage in asthma. Curr Opin Pulm Med. 2020;26(1):62–8. - PMC - PubMed
    1. Belkaid Y, Segre JA. Dialogue between skin microbiota and immunity. Science. 2014;346(6212):954–9. - PubMed