

DeepCarc: Deep Learning-Powered Carcinogenicity Prediction Using Model-Level Representation
- PMID: 34870186
- PMCID: PMC8636933
- DOI: 10.3389/frai.2021.757780
DeepCarc: Deep Learning-Powered Carcinogenicity Prediction Using Model-Level Representation
Erratum in
-
Corrigendum: DeepCarc: Deep learning-powered carcinogenicity prediction using model-level representation.Front Artif Intell. 2022 Nov 28;5:1046668. doi: 10.3389/frai.2022.1046668. eCollection 2022. Front Artif Intell. 2022. PMID: 36518910 Free PMC article.
Abstract
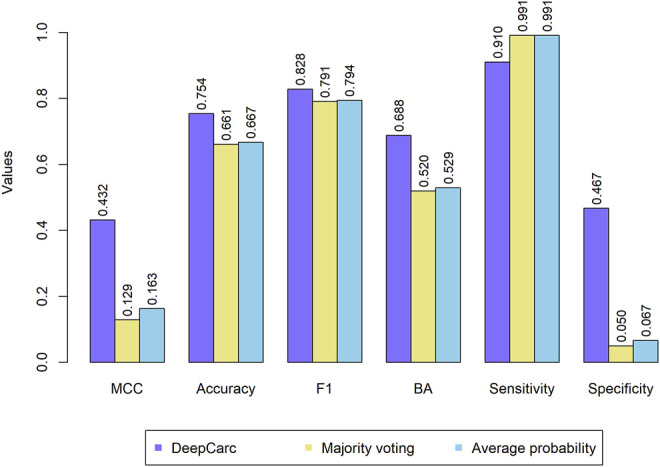
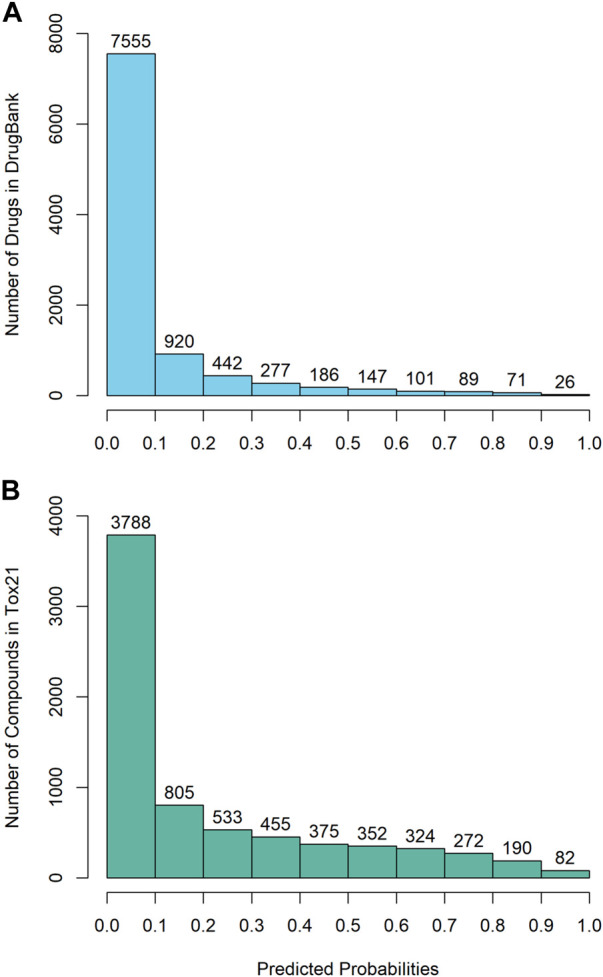
Carcinogenicity testing plays an essential role in identifying carcinogens in environmental chemistry and drug development. However, it is a time-consuming and label-intensive process to evaluate the carcinogenic potency with conventional 2-years rodent animal studies. Thus, there is an urgent need for alternative approaches to providing reliable and robust assessments on carcinogenicity. In this study, we proposed a DeepCarc model to predict carcinogenicity for small molecules using deep learning-based model-level representations. The DeepCarc Model was developed using a data set of 692 compounds and evaluated on a test set containing 171 compounds in the National Center for Toxicological Research liver cancer database (NCTRlcdb). As a result, the proposed DeepCarc model yielded a Matthews correlation coefficient (MCC) of 0.432 for the test set, outperforming four advanced deep learning (DL) powered quantitative structure-activity relationship (QSAR) models with an average improvement rate of 37%. Furthermore, the DeepCarc model was also employed to screen the carcinogenicity potential of the compounds from both DrugBank and Tox21. Altogether, the proposed DeepCarc model could serve as an early detection tool (https://github.com/TingLi2016/DeepCarc) for carcinogenicity assessment.
Keywords: NCTRlcdb; QSAR; carcinogenicity; deep learning; non-animal models.
Copyright © 2021 Li, Tong, Roberts, Liu and Thakkar.
Conflict of interest statement
RR is co-founder and co-director of ApconiX, an integrated toxicology and ion channel company that provides expert advice on non-clinical aspects of drug discovery and drug development to academia, industry, and not-for-profit organizations. The remaining authors declare that the research was conducted in the absence of any commercial or financial relationships that could be construed as a potential conflict of interest.
Figures

Similar articles
-
Corrigendum: DeepCarc: Deep learning-powered carcinogenicity prediction using model-level representation.Front Artif Intell. 2022 Nov 28;5:1046668. doi: 10.3389/frai.2022.1046668. eCollection 2022. Front Artif Intell. 2022. PMID: 36518910 Free PMC article.
-
DeepDILI: Deep Learning-Powered Drug-Induced Liver Injury Prediction Using Model-Level Representation.Chem Res Toxicol. 2021 Feb 15;34(2):550-565. doi: 10.1021/acs.chemrestox.0c00374. Epub 2020 Dec 23. Chem Res Toxicol. 2021. PMID: 33356151
-
Prediction of rodent carcinogenic potential of naturally occurring chemicals in the human diet using high-throughput QSAR predictive modeling.Toxicol Appl Pharmacol. 2007 Jul 1;222(1):1-16. doi: 10.1016/j.taap.2007.03.012. Epub 2007 Mar 24. Toxicol Appl Pharmacol. 2007. PMID: 17482223
-
Carcinogenicity of the aromatic amines: from structure-activity relationships to mechanisms of action and risk assessment.Mutat Res. 2002 Jul;511(3):191-206. doi: 10.1016/s1383-5742(02)00008-x. Mutat Res. 2002. PMID: 12088717 Review.
-
The comet assay with multiple mouse organs: comparison of comet assay results and carcinogenicity with 208 chemicals selected from the IARC monographs and U.S. NTP Carcinogenicity Database.Crit Rev Toxicol. 2000 Nov;30(6):629-799. doi: 10.1080/10408440008951123. Crit Rev Toxicol. 2000. PMID: 11145306 Review.
Cited by
-
Advances of Artificial Intelligence in Anti-Cancer Drug Design: A Review of the Past Decade.Pharmaceuticals (Basel). 2023 Feb 7;16(2):253. doi: 10.3390/ph16020253. Pharmaceuticals (Basel). 2023. PMID: 37259400 Free PMC article. Review.
-
Four functional genotoxic marker genes (Bax, Btg2, Ccng1, and Cdkn1a) discriminate genotoxic hepatocarcinogens from non-genotoxic hepatocarcinogens and non-genotoxic non-hepatocarcinogens in rat public toxicogenomics data, Open TG-GATEs.Genes Environ. 2024 Dec 19;46(1):28. doi: 10.1186/s41021-024-00322-8. Genes Environ. 2024. PMID: 39702344 Free PMC article.
-
Recent advances in AI-based toxicity prediction for drug discovery.Front Chem. 2025 Jul 8;13:1632046. doi: 10.3389/fchem.2025.1632046. eCollection 2025. Front Chem. 2025. PMID: 40698059 Free PMC article. Review.
-
Short-term in vivo testing to discriminate genotoxic carcinogens from non-genotoxic carcinogens and non-carcinogens using next-generation RNA sequencing, DNA microarray, and qPCR.Genes Environ. 2023 Feb 9;45(1):7. doi: 10.1186/s41021-023-00262-9. Genes Environ. 2023. PMID: 36755350 Free PMC article. Review.
-
Role of artificial intelligence in revolutionizing drug discovery.Fundam Res. 2024 May 9;5(3):1273-1287. doi: 10.1016/j.fmre.2024.04.021. eCollection 2025 May. Fundam Res. 2024. PMID: 40528990 Free PMC article. Review.
References
-
- Breiman L. (1996). Bagging Predictors. Mach Learn. 24, 123–140. 10.1007/bf00058655 - DOI
LinkOut - more resources
Full Text Sources
Research Materials