. 2021 Oct 27;3(6):e210097.
doi: 10.1148/ryai.2021210097. eCollection 2021 Nov.

Toward Generalizability in the Deployment of Artificial Intelligence in Radiology: Role of Computation Stress Testing to Overcome Underspecification

Affiliations

Toward Generalizability in the Deployment of Artificial Intelligence in Radiology: Role of Computation Stress Testing to Overcome Underspecification

Thomas Eche et al. Radiol Artif Intell. .

Abstract

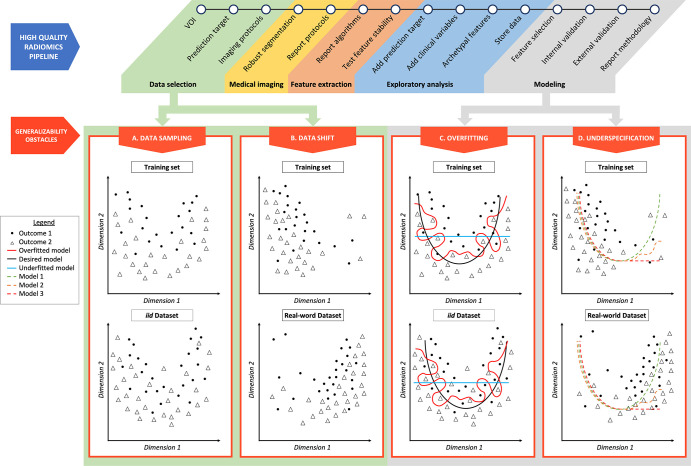
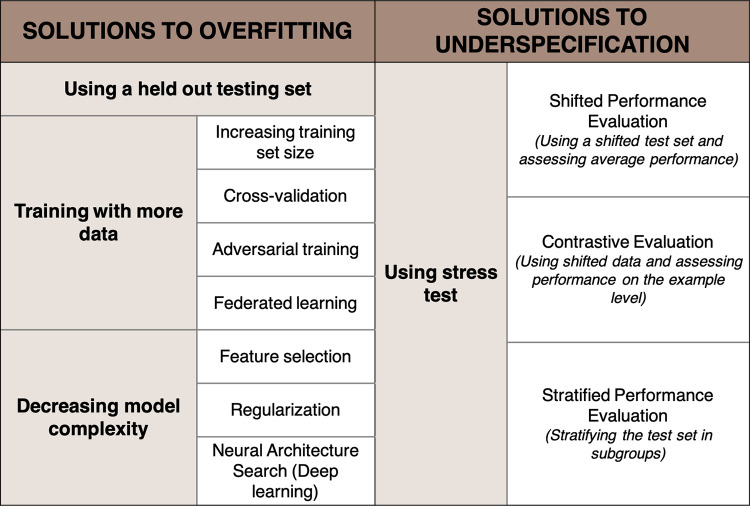
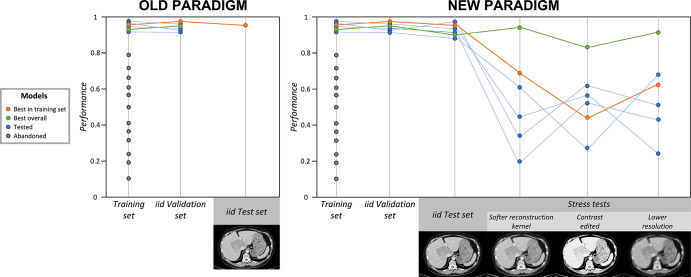
The clinical deployment of artificial intelligence (AI) applications in medical imaging is perhaps the greatest challenge facing radiology in the next decade. One of the main obstacles to the incorporation of automated AI-based decision-making tools in medicine is the failure of models to generalize when deployed across institutions with heterogeneous populations and imaging protocols. The most well-understood pitfall in developing these AI models is overfitting, which has, in part, been overcome by optimizing training protocols. However, overfitting is not the only obstacle to the success and generalizability of AI. Underspecification is also a serious impediment that requires conceptual understanding and correction. It is well known that a single AI pipeline, with prescribed training and testing sets, can produce several models with various levels of generalizability. Underspecification defines the inability of the pipeline to identify whether these models have embedded the structure of the underlying system by using a test set independent of, but distributed identically, to the training set. An underspecified pipeline is unable to assess the degree to which the models will be generalizable. Stress testing is a known tool in AI that can limit underspecification and, importantly, assure broad generalizability of AI models. However, the application of stress tests is new in radiologic applications. This report describes the concept of underspecification from a radiologist perspective, discusses stress testing as a specific strategy to overcome underspecification, and explains how stress tests could be designed in radiology-by modifying medical images or stratifying testing datasets. In the upcoming years, stress tests should become in radiology the standard that crash tests have become in the automotive industry. Keywords: Computer Applications-General, Informatics, Computer-aided Diagnosis © RSNA, 2021.

Keywords: Computer Applications-General; Computer-aided Diagnosis; Informatics.


Conflict of interest statement

Disclosures of conflicts of interest: T.E. No relevant relationships. L.H.S. Consultant for Merck and Regeneron (member, DSMB and endpoint analysis committees). F.Z.M. No relevant relationships. L.D. No relevant relationships.

Figures

Radiomics pipeline examples of overfitting and underspecification. A
high-quality radiomics pipeline is shown. Data selection can be affected by
data sampling and data shift. Modeling can be biased as a result of
overfitting and underspecification. (A) Data sampling. The training set and
an independent and identically distributed (iid) dataset are represented,
respectively, in the top and bottom figures. Even if following the same
distribution, resampling data induces small variations in outcome positions.
(B) Data shift. The training dataset and a dataset drawn from the real world
are represented, respectively, in the top and bottom figures. Outcomes of
low values of dimension 1 are overrepresented in the training set, and
outcomes of high values of dimension 1 are overrepresented in the real-world
dataset. (C) Overfitting. The red line represents an overfitted model, which
is able to isolate every outcome 1 from outcome 2 in the training set. When
applied to an iid dataset, its performance deteriorates. The black line
represents the desired model, performing identically in a training dataset
and in an iid dataset. The blue line represents an underfitted model. (D)
Underspecification. Three models (green, orange, and red dotted lines) are
trained in a training set in which outcomes of low values of dimension 1 are
overrepresented (top figure). These three models fit data well for low
values of dimension 1. For high values of dimension 1, models 1 (green
dotted line), 2 (orange dotted line), and 3 (red dotted line) behave
differently. These three models will perform equally in an iid testing set.
However, if the real-world dataset (bottom figure) presents a data shift,
characterized by an overrepresentation of dimension 1 high values, model 1
segregates outcomes better than models 2 and 3 and represents the best model
regarding generalizability. VOI = volume of interest.
Figure 1:
Radiomics pipeline examples of overfitting and underspecification. A high-quality radiomics pipeline is shown. Data selection can be affected by data sampling and data shift. Modeling can be biased as a result of overfitting and underspecification. (A) Data sampling. The training set and an independent and identically distributed (iid) dataset are represented, respectively, in the top and bottom figures. Even if following the same distribution, resampling data induces small variations in outcome positions. (B) Data shift. The training dataset and a dataset drawn from the real world are represented, respectively, in the top and bottom figures. Outcomes of low values of dimension 1 are overrepresented in the training set, and outcomes of high values of dimension 1 are overrepresented in the real-world dataset. (C) Overfitting. The red line represents an overfitted model, which is able to isolate every outcome 1 from outcome 2 in the training set. When applied to an iid dataset, its performance deteriorates. The black line represents the desired model, performing identically in a training dataset and in an iid dataset. The blue line represents an underfitted model. (D) Underspecification. Three models (green, orange, and red dotted lines) are trained in a training set in which outcomes of low values of dimension 1 are overrepresented (top figure). These three models fit data well for low values of dimension 1. For high values of dimension 1, models 1 (green dotted line), 2 (orange dotted line), and 3 (red dotted line) behave differently. These three models will perform equally in an iid testing set. However, if the real-world dataset (bottom figure) presents a data shift, characterized by an overrepresentation of dimension 1 high values, model 1 segregates outcomes better than models 2 and 3 and represents the best model regarding generalizability. VOI = volume of interest.
Strategies to overcome overfitting and underspecification.
Figure 2:
Strategies to overcome overfitting and underspecification.
Old and new paradigms: application of stress tests to counteract
underspecification. The gray dots indicate models that were abandoned
because of their low performance in the training set. The blue dots indicate
models that performed well in the training set and were selected to continue
to the validation and testing phases. The orange dots indicate the
best-performing model in training, in independent and identically
distributed (iid) validation, and in iid testing; however, this model
performed poorly during stress tests. The green dots indicate the best
overall model, which performed well in training, in iid validation, in iid
testing, and during stress tests, and is more likely to be the most broadly
generalizable model. In the old paradigm (left), after training, the
best-performing model in the training set is validated and then tested with
iid data. If the performance is satisfying, the model is deployed. In the
new paradigm (right), six models (blue, orange, and green dots and lines)
trained on the same training set are selected for validation and testing.
After iid validation and iid testing, their performances are assessed by
using three stress tests, designed with artificially modified CT scans, with
the application of blurring and pixelating filters, and with contrast
modification. All six models show great accuracy in the iid validation and
iid test sets, but the green model is the only one that performs well
throughout all stress tests. Therefore, the green model is the one that is
the most likely to broadly generalize well (ie, to maintain high performance
even when applied to shifted datasets). Adding stress tests to the pipeline
allowed the green model to be distinguished from others.
Figure 3:
Old and new paradigms: application of stress tests to counteract underspecification. The gray dots indicate models that were abandoned because of their low performance in the training set. The blue dots indicate models that performed well in the training set and were selected to continue to the validation and testing phases. The orange dots indicate the best-performing model in training, in independent and identically distributed (iid) validation, and in iid testing; however, this model performed poorly during stress tests. The green dots indicate the best overall model, which performed well in training, in iid validation, in iid testing, and during stress tests, and is more likely to be the most broadly generalizable model. In the old paradigm (left), after training, the best-performing model in the training set is validated and then tested with iid data. If the performance is satisfying, the model is deployed. In the new paradigm (right), six models (blue, orange, and green dots and lines) trained on the same training set are selected for validation and testing. After iid validation and iid testing, their performances are assessed by using three stress tests, designed with artificially modified CT scans, with the application of blurring and pixelating filters, and with contrast modification. All six models show great accuracy in the iid validation and iid test sets, but the green model is the only one that performs well throughout all stress tests. Therefore, the green model is the one that is the most likely to broadly generalize well (ie, to maintain high performance even when applied to shifted datasets). Adding stress tests to the pipeline allowed the green model to be distinguished from others.

References

    1. Bluemke DA, Moy L, Bredella MA, et al. . Assessing radiology research on artificial intelligence: a brief guide for authors, reviewers, and readers—from the Radiology editorial board. Radiology 2020;294(3):487–489. - PubMed
    1. Collins GS, Reitsma JB, Altman DG, Moons KGM;Members of the TRIPOD Group . Transparent reporting of a multivariable prediction model for individual prognosis or diagnosis (TRIPOD): the TRIPOD statement. Eur Urol 2015;67(6):1142–1151. - PubMed
    1. Park SH, Han K. Methodologic guide for evaluating clinical performance and effect of artificial intelligence technology for medical diagnosis and prediction. Radiology 2018;286(3):800–809. - PubMed
    1. Soffer S, Ben-Cohen A, Shimon O, Amitai MM, Greenspan H, Klang E. Convolutional neural networks for radiologic images: a radiologist's guide. Radiology 2019;290(3):590–606. - PubMed
    1. Chang PJ. Moving artificial intelligence from feasible to real: time to drill for gas and build roads. Radiology 2020;294(2):432–433. - PubMed

LinkOut - more resources