

Optimising health and economic impacts of COVID-19 vaccine prioritisation strategies in the WHO European Region: a mathematical modelling study
- PMID: 34870256
- PMCID: PMC8629724
- DOI: 10.1016/j.lanepe.2021.100267
Optimising health and economic impacts of COVID-19 vaccine prioritisation strategies in the WHO European Region: a mathematical modelling study
Abstract
Background: Countries in the World Health Organization (WHO) European Region differ in terms of the COVID-19 vaccine supply conditions. We evaluated the health and economic impact of different age-based vaccine prioritisation strategies across this demographically and socio-economically diverse region.
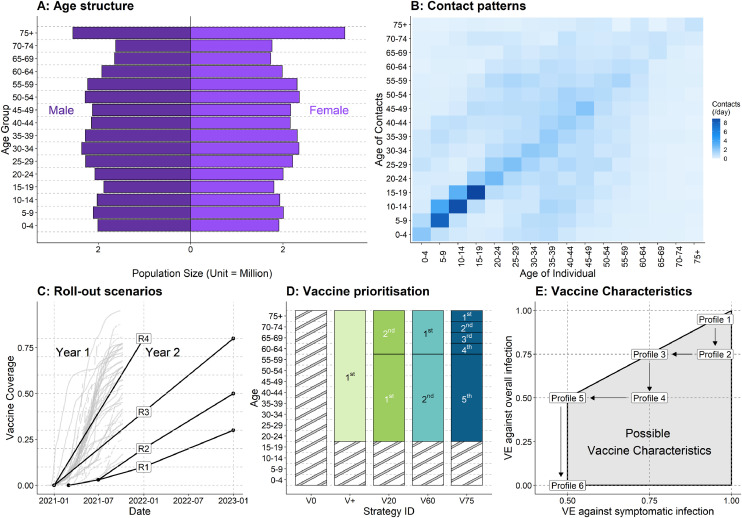
Methods: We fitted age-specific compartmental models to the reported daily COVID-19 mortality in 2020 to inform the immunity level before vaccine roll-out. Models capture country-specific differences in population structures, contact patterns, epidemic history, life expectancy, and GDP per capita.We examined four strategies that prioritise: all adults (V+), younger (20-59 year-olds) followed by older adults (60+) (V20), older followed by younger adults (V60), and the oldest adults (75+) (V75) followed by incrementally younger age groups. We explored four roll-out scenarios (R1-4) - the slowest scenario (R1) reached 30% coverage by December 2022 and the fastest (R4) 80% by December 2021. Five decision-making metrics were summarised over 2021-22: mortality, morbidity, and losses in comorbidity-adjusted life expectancy, comorbidity- and quality-adjusted life years, and human capital. Six vaccine profiles were tested - the highest performing vaccine has 95% efficacy against both infection and disease, and the lowest 50% against diseases and 0% against infection.
Findings: Of the 20 decision-making metrics and roll-out scenario combinations, the same optimal strategy applied to all countries in only one combination; V60 was more or similarly desirable than V75 in 19 combinations. Of the 38 countries with fitted models, 11-37 countries had variable optimal strategies by decision-making metrics or roll-out scenarios. There are greater benefits in prioritising older adults when roll-out is slow and when vaccine profiles are less favourable.
Interpretation: The optimal age-based vaccine prioritisation strategies were sensitive to country characteristics, decision-making metrics, and roll-out speeds. A prioritisation strategy involving more age-based stages (V75) does not necessarily lead to better health and economic outcomes than targeting broad age groups (V60). Countries expecting a slow vaccine roll-out may particularly benefit from prioritising older adults.
Funding: World Health Organization, Bill and Melinda Gates Foundation, the Medical Research Council (United Kingdom), the National Institute of Health Research (United Kingdom), the European Commission, the Foreign, Commonwealth and Development Office (United Kingdom), Wellcome Trust.
Keywords: COVID-19; Europe; Health economics; Mathematical modelling; Multicountry analysis; Policy evaluation; Vaccine policy.
© 2021 The Author(s).
Conflict of interest statement
YL and MJ report grants from the National Institute of Health Research outside the submitted work (16/137/109). RCB and MJ are participants of the Scientific Pandemic Influenza Group on Modelling. The views expressed in this publication are those of the author(s) and not necessarily those of the European Commission, National Institute of Health Research (NIHR) (UK), Public Health England (PHE) or the Department of Health and Social Care (UK). The authors alone are responsible for the views expressed in this publication, and they do not necessarily represent the decisions or policies of the World Health Organization.
Figures


Update of
-
Optimising health and economic impacts of COVID-19 vaccine prioritisation strategies in the WHO European Region.medRxiv [Preprint]. 2021 Jul 14:2021.07.09.21260272. doi: 10.1101/2021.07.09.21260272. medRxiv. 2021. Update in: Lancet Reg Health Eur. 2022 Jan;12:100267. doi: 10.1016/j.lanepe.2021.100267. PMID: 34282421 Free PMC article. Updated. Preprint.
References
-
- Courtemanche C, Garuccio J, Le A, Pinkston J, Yelowitz A. Strong social distancing measures In the United States reduced the COVID-19 growth rate. Health Aff. 2020;39:1237–1246. - PubMed
-
- Gavi, the Vaccine Alliance. The COVAX Facility: Interim Distribution Forecast. 2021 https://www.gavi.org/sites/default/files/covid/covax/COVAX-Interim-Distr... (accessed March 26, 2021).
-
- World Health Organization. COVAX Announces additional deals to access promising COVID-19 vaccine candidates; plans global rollout starting Q1 2021. World Health Organization. 2020; published online Dec 18. https://www.who.int/news/item/18-12-2020-covax-announces-additional-deal... (accessed April 11, 2021).
Grants and funding
LinkOut - more resources
Full Text Sources
