. 2021 Oct 13;1(1):100005.
doi: 10.1016/j.xgen.2021.100005.

Sequencing-based genome-wide association studies reporting standards

Affiliations

Sequencing-based genome-wide association studies reporting standards

Aoife McMahon et al. Cell Genom. .

Abstract

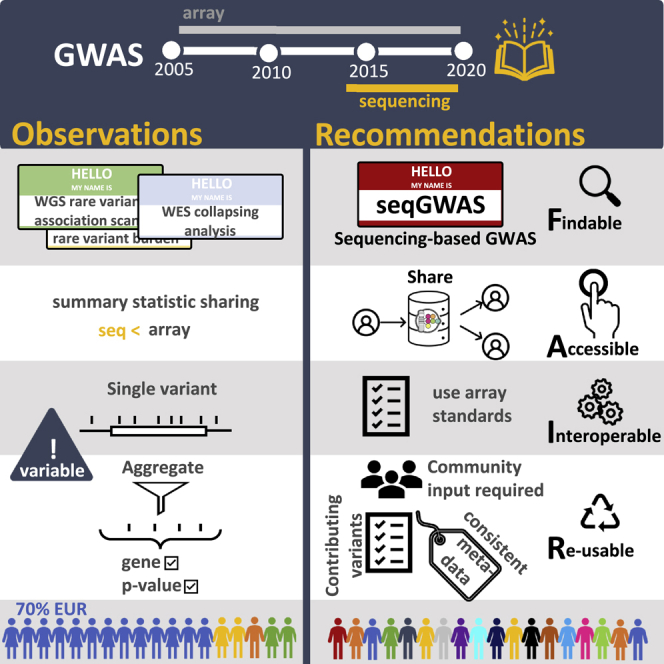
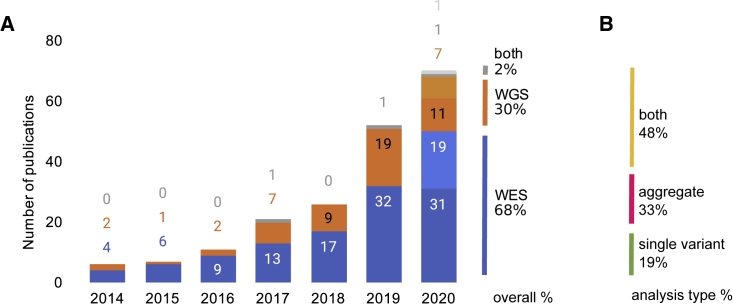
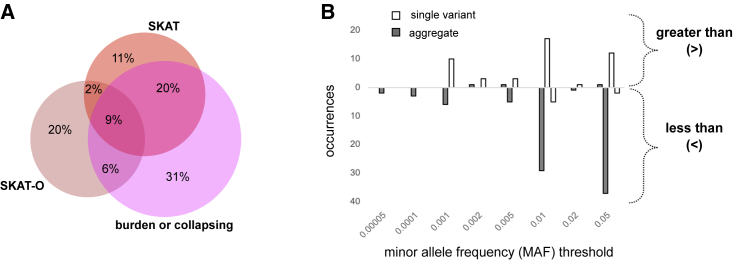
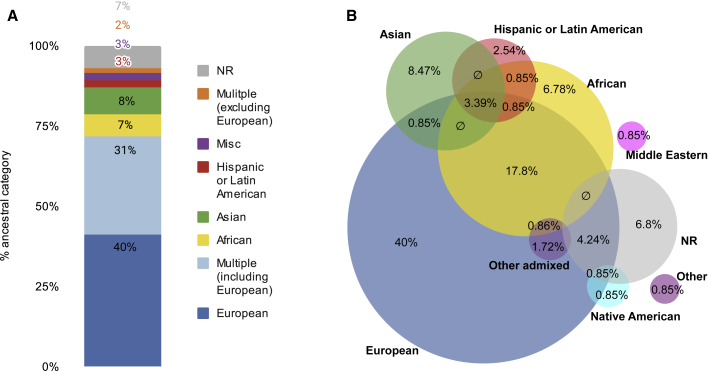
Genome sequencing has recently become a viable genotyping technology for use in genome-wide association studies (GWASs), offering the potential to analyze a broader range of genome-wide variation, including rare variants. To survey current standards, we assessed the content and quality of reporting of statistical methods, analyses, results, and datasets in 167 exome- or genome-wide-sequencing-based GWAS publications published from 2014 to 2020; 81% of publications included tests of aggregate association across multiple variants, with multiple test models frequently used. We observed a lack of standardized terms and incomplete reporting of datasets, particularly for variants analyzed in aggregate tests. We also find a lower frequency of sharing of summary statistics compared with array-based GWASs. Reporting standards and increased data sharing are required to ensure sequencing-based association study data are findable, interoperable, accessible, and reusable (FAIR). To support that, we recommend adopting the standard terminology of sequencing-based GWAS (seqGWAS). Further, we recommend that single-variant analyses be reported following the same standards and conventions as standard array-based GWASs and be shared in the GWAS Catalog. We also provide initial recommended standards for aggregate analyses metadata and summary statistics.


Conflict of interest statement

An immediate family member of J.A.L.M. is an employee and shareholder of Illumina.

Figures

None
Graphical abstract
Figure 1
Figure 1
Sequencing-based GWAS publications, numbers, sequencing coverage, and analysis types (A) Number of sequencing-based association publications identified per year from 2014 to September 2020, n = 167. Only genome-wide (and not limited to specific regions or subsets of genes) and population-based studies are included (see STAR Methods for more information). The final quarter of 2020 is projected based on the rate of growth in the final quarter of 2019 (projected data are presented in the light shade of each color). (B) The analysis types included in those publications. “Aggregate” refers to multi-variant analyses.
Figure 2
Figure 2
Statistical analysis methods used in sequencing-based GWAS publications (A) Overlap among methods used in aggregate-analysis publications. Of 65 publications that use either SKAT, SKAT-O, or a burden test, 40% use at least two methods. Text related to study design was extracted by experienced curators and searched for the terms “SKAT,” “SKAT-O,” and “burden” or “collaps∗” (where ∗ refers to a wildcard for searching). (B) Minor allele frequency thresholds used in single-variant and aggregate analyses. “Greater than or equal to” thresholds are displayed above the x axis; “less than or equal to” thresholds are displayed below the x axis. Thresholds were extracted from publications in which one or two thresholds were provided (single variant: n = 53 thresholds from 51 publications; aggregate: n = 86 thresholds from 77 publications). See Figure S4 for additional details on MAF-threshold reporting.
Figure 3
Figure 3
Ancestry of individuals used in sequencing-based GWAS publications Publication-level breakdown of the broad ancestry categories, defined per the GWAS Catalog ancestry framework. Some categories are collapsed for ease of display, analysis is based on 2014–2019 publications, n = 120. (A) Overview of the percentage of publications that included only one or multiple ancestral categories. (B) The proportion of publications that included the specified broad ancestral category. Overlaps indicate multiple ancestries were included in one publication; indicates an empty set. Venn diagram was created using DeepVenn. Note that Venn diagrams of this size cannot be fully proportional (see Figure S7 and Table S5 for full data).

References

    1. Klein R.J., Xu X., Mukherjee S., Willis J., Hayes J. Successes of genome-wide association studies. Cell. 2010;142:350–351. author reply 353–355. - PubMed
    1. Wellcome Trust Case Control Consortium Genome-wide association study of 14,000 cases of seven common diseases and 3,000 shared controls. Nature. 2007;447:661–678. - PMC - PubMed
    1. DePristo M.A., Banks E., Poplin R., Garimella K.V., Maguire J.R., Hartl C., Philippakis A.A., del Angel G., Rivas M.A., Hanna M., et al. A framework for variation discovery and genotyping using next-generation DNA sequencing data. Nat. Genet. 2011;43:491–498. - PMC - PubMed
    1. Pasaniuc B., Rohland N., McLaren P.J., Garimella K., Zaitlen N., Li H., Gupta N., Neale B.M., Daly M.J., Sklar P., et al. Extremely low-coverage sequencing and imputation increases power for genome-wide association studies. Nat. Genet. 2012;44:631–635. - PMC - PubMed
    1. Eichler E.E., Flint J., Gibson G., Kong A., Leal S.M., Moore J.H., Nadeau J.H. Missing heritability and strategies for finding the underlying causes of complex disease. Nat. Rev. Genet. 2010;11:446–450. - PMC - PubMed